Set 9 - Quarter 2
⏳ Age Gaps, ☎️ Calling Home, 👅 Going Down, and 🪩 Going Out

Hello from SapphicSavvy!
Quarter 2 of Set 9. This week: age gaps, calling home, going down, and going out. In that order, which is also the order of a very specific kind of Saturday.
Let's go.
⏳ Mind the Gap
Back in Set 2 Quarter 1, we asked what age gap you'd consider acceptable. The woman writing these posts at the time looked at the results and said, "I'm not going to touch this one!"
Bless her. I'm touching it.
48% of you have been in a relationship with an age gap of five years or more. Y'all guessed 46%. Overall, that's a great guess.
The overall number was hiding something, though.
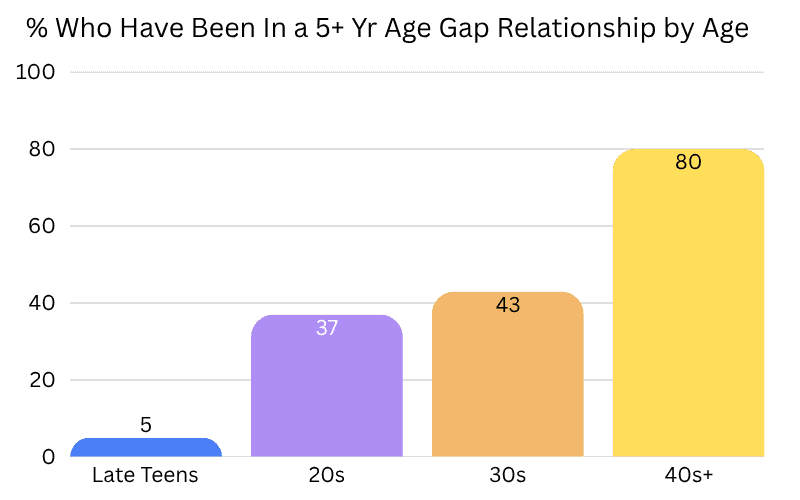
Late teens 5%, 20s 37%, 30s 43%, 40s+ 80%.
Seventy-five points from the youngest group to the oldest. And the guesses squished that whole range into the middle:
• Late teens guessed 29%. Real answer: 5%.
• 20s guessed 38%. Real: 37%.
• 30s guessed 47%. Real: 43%.
• 40s+ guessed 58%. Real: 80%
The 20s and 30s nailed it. The two ends of the age range missed in opposite directions, by more
than 20 points each. The late teens think their peers are way more into age gaps than they are.
The 40s+ think their peers are way less into them.
The 80% isn't a scandal. It's arithmetic. Five years means a different thing depending on when it
happens:
• At 19: she has a 401(k), you have a meal plan.
• At 29: she's been to more weddings than you. That's about it.
• At 49: you both own reading glasses and have opinions about the thermostat.
The older you get, the more five years shrinks. And this was an "ever" question, so every extra decade of dating is another chance to land one. In case anyone wants to run the old "half your age plus seven" rule, a 47-year-old's minimum is 30.5. Our 40s+ users have plenty of room to work with.
This is also the second time in two Sets that the 40s+ sold themselves short. In Set 8 Quarter 4, they were the only group we underestimated on the three-month U-Haul (42.7% guessed vs. 48% actual). The 40s+ have the most lore in this app, and somehow they're the ones who forget it.
As for the late teens: at 18 or 19, a five-year gap means a partner who's at least 23 or 24. So 5% is low, and frankly that's the number we were hoping for. Sincere beat, on purpose: age gaps aren't automatically a problem, but at the very start of adulthood the power dynamics deserve a real look. Autostraddle's Summer Tao has a good piece with four questions to ask before getting into one: are you at the same life stage, do your energy levels match, where's the money, and who has the power? Her summary is "follow your heart but keep your eyes open." Link at the bottom.

Lesbian 46%, bisexual 50%, queer 54%.
This question asked you about your own identity group and age group, and the lesbians walked away with the award for self-knowledge. They guessed 45.9% for themselves and came in at 46%. Bisexual users guessed 44% (real 50%) and queer users guessed 46% (real 54%), so both groups sold themselves a little short. Queer users lead, but the spread here is small, and I wouldn't build a whole theory on it.
Now, the stereotype. Everyone's first lesbian age gap was watching Carol, and the internet has been running with it ever since. The government has numbers on this, too. Census data from 2021 shows married women in same-sex couples have an average age gap of about 5 years, compared with about 3.7 for married opposite-sex couples. Only 27% of female same-sex spouses are within two years of each other, compared with 35% of opposite-sex spouses. And 5% of same-sex spouses have a gap of 20+ years. For opposite-sex couples, it's 1%.
My theory is boring and mathematical: a smaller dating pool means a wider search radius. Back in Set 3 Quarter 3, you told us you'd travel 571 miles to see someone you were dating. If you won't let 571 miles stop you, you're not going to let a birth year do it.
☎️ Call Your Mother
The typical user talks to their parent(s) on about 11.5 days a month, so every two or three days.
Y'all guessed 9.

Late teens 15.5, 20s 14.5, 30s 12, 40s+ 6.5.
The number slides down steadily with age. The guesses didn't follow it:
• Late teens guessed 11.9. Real: 15.5.
• 20s guessed 11.1. Real: 14.5.
• 30s guessed 7.5. Real: 12.
• 40s+ guessed 7.6. Real: 6.5.
Every group under 40 guessed low, and the 30s missed by the most. They think their peers check in about once every four days. It's closer to every two and a half.
Yes, the 30s. The chaos cohort. The group that led on 3+ orgasms in a session (Set 6 Quarter 3), squirting (Set 4 Quarter 3), and polyamory (Set 5 Quarter 2) is also on the phone with mom twelve days a month. You can't have the full 30s experience without debriefing it with a parent. (Not the orgasm part. Hopefully.)
The 40s+ were the only group to land close. They're also the group most likely to have lost someone. Sincere beat, on purpose: Census data shows nearly a quarter of people in their 30s have already lost at least one parent, and that share keeps climbing every decade. For a lot of people, a lower number isn't about distance. It's about who's still here to call. If that's you, we're sorry, and we're glad you're here with us.
For national context, a 2024 Pew survey of adults 18 to 34 found that 46% talk or video chat with a parent at least a few times a week. Among young women it's 55%, and 19% of young women talk to a parent every day. Our late teens and 20s are right in that range, maybe a little above it. (We didn't say whether texting counts. Y'all probably counted it. Fair.)
And here's a fun one: in Set 9 Quarter 1, 87% of you said you wish you spent less time on your phone. I'm guessing nobody was thinking of the calls home when they said that.
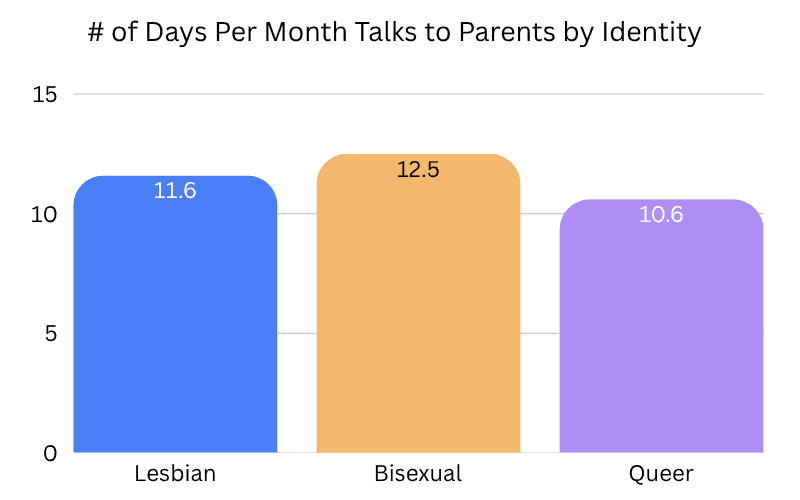
Lesbian 11.6, bisexual 12.5, queer 10.6.
All three groups are in the same neighborhood. Bisexual users are a hair ahead, which is interesting, because most of the research would bet the other way:
• A 2022 study in the Journal of Marriage and Family followed thousands of parent-child relationships for more than 20 years. Bisexual adults were nearly three times as likely as straight adults to be estranged from their fathers. Gay and lesbian adults were 86% more likely. There was no difference with mothers.
• Pew's big 2013 survey of LGBT adults found 67% of lesbians had come out to their mother, compared with 47% of bisexual women.
So why are bi users calling home the most? My best guess: talking to your parents is easier when there's less friction in the room, and for some bisexual users, sexuality may just not come up at Sunday dinner. That fits Set 4 Quarter 4, when bisexual users were also the least likely to be out to their primary care doctor. Speculation, as always. It's also a group of 22 people this round, so hold it loosely.
Every identity group also guessed low for its age peers: lesbians guessed 9.5, bisexual users 8.7, queer users 8.2. That's two to four days a month below where each group actually is.
We tell a certain story about queer people and family. We got kicked out, we found chosen family, and we see the relatives at Thanksgiving under duress. For plenty of people that's real. In Set 4 Quarter 1, 70% of you said at least one family member voted for Tr*mp. But in Set 6 Quarter 1, you told us the typical user has about five family members who fully support them, and Pew found that more LGBT adults said coming out made their relationship with their mother stronger (39%) than weaker (14%). This week, you're calling home every couple of days. The chosen family is real. So is the group chat with mom.
National Coming Out Day is this Sunday, October 11th. If you're out to your parents and they've been good to you, call them. You were going to anyway. Apparently.
👅 Lip Service
Only 13% of you don't really enjoy going down on women.
That means 87% of you do. Good for you. Good for them.
Y'all guessed 24%. Almost double. We really thought a quarter of this community was down there checking the time.

Lesbian 13%, bisexual 9%, queer 15%.
The three groups are close together. The guesses are where it gets juicy. You guessed for your own identity group, and every group overestimated how many of its own people aren't into it:
• Lesbians guessed 23%. Real: 13%.
• Queer users guessed 24%. Real: 15%.
• Bisexual users guessed 27%. Real: 9%.
Bisexual users had the biggest miss on the whole question, three times too high, about themselves. And they came in as the group that enjoys it most.
We've seen this movie before. Bi women hear the "you're not really into women" line constantly: it's a phase, it's for attention, it's for a man to watch. We covered the "just a phase" version back in Set 6 Quarter 3. This week, it looks like some of that stereotype got into bi users' own guesses. The data doesn't back it up. Put it on a tote bag: Bisexual and Enthusiastic.

Late teens 19%, 20s 9%, 30s 9%, 40s+ 19%.
A U-shape, with the 20s and 30s as the most enthusiastic. One caution: 19% of our late teens is about four people, and 19% of the 40s+ is about eleven. So don't read too much into the shape.
Here's the part I love, though. The guesses made the same U. Late teens guessed 29% for their identity group, the 20s guessed 20%, the 30s guessed 22%, and the 40s+ guessed 27%. Wrong numbers, right shape. Each age group seems to have taken its own experience and scaled it up. Last week I called this the "everybody I know does this" effect. This week it's "everybody I know is lukewarm on this."
Why the U? Speculation, clearly labeled:
• Late teens: less practice. In Set 7 Quarter 4, 63% of our late teens hadn't had partnered sex in the past month, and in Set 8 Quarter 1 they reported 0% orgasms from scissoring. Advanced moves take reps. So does this. Nobody comes out of the womb knowing what to do down there.
• 40s+: this group includes more people who came out later in life, more long-term relationships where routines settle in, and bodies that change. Not loving it the way you used to isn't the same as not doing it.
Before anyone yells "pillow princess": that's a different question. Pillow princesses are about receiving and not reciprocating. We asked how you feel about the giving end.
Some outside numbers. The comparison data is almost all about women going down on men. A Canadian study of about 900 mostly straight college students found 17.3% of women didn't find giving oral sex pleasurable. The same study found women enjoyed giving more when their partner reciprocated. Between two women, that's kind of the whole idea. Our 13% for going down on women comes in under that.
Autostraddle's lesbian sex survey (more than 13,000 queer women) found 87% of respondents gave oral sex and 82% received it. When readers named their favorite sex act, oral "easily came out on top." And in a national study of more than 52,000 adults, 86% of lesbians said they usually or always orgasm during sex, compared with 65% of straight women. Women who received more oral sex were more likely to orgasm. Back in Set 6 Quarter 3, nearly 60% of you said you'd had three or more orgasms with a partner in one session. I think we know at least part of how.
Sincere beat, on purpose: that same Autostraddle survey found fewer than 6% of respondents used dental dams, and 73% used no protection at all. Oral sex between women can pass along herpes, HPV, syphilis, gonorrhea, and chlamydia. In Set 8 Quarter 3, 13% of you said you'd gotten an STI from a partner. Same number as this week, by total coincidence. You don't have to become a dental dam person overnight. Just get tested regularly, and tell your doctor what kind of sex you're actually having.
🪩 Party of One (Point Five)
The typical user went out specifically to party about 1.5 times this month.
Y'all guessed 3.1.
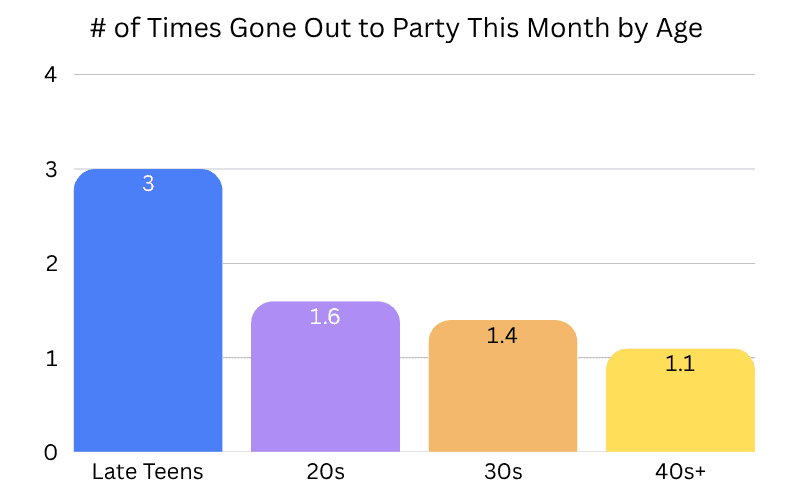
Late teens 3, 20s 1.6, 30s 1.4, 40s+ 1.1.
The late teens are our party animals at three nights out a month. Everyone else goes out about once, give or take a birthday.
The guesses were double the real number at every age. Not most ages. Every age:
• Late teens guessed 6.1. Real: 3.
• 20s guessed 3.7. Real: 1.6.
• 30s guessed 2.5. Real: 1.4.
• 40s+ guessed 2. Real: 1.1.
Call it the SapphicSavvy 2x rule: however much you think your friends are going out, cut it in half.
Now, the late teens going out the most doesn't mean they're drinking the most. In Set 6 Quarter 2, our youngest users had the most alcohol-free days of anyone. Gallup's newest numbers (July 2026) have only 54% of American adults drinking at all, tied for the lowest in the poll's history, which goes back to 1939. For 18 to 34 year olds, it's 50%. So "going out to party" in 2026 can mean a sober rave, a house party with a good playlist, or a dance night where the strongest thing in your cup is a Celsius. The kids are going out. They're just not getting wrecked.

Lesbian 1.6, bisexual 1.2, queer 1.5.
Basically a tie, with lesbians a hair ahead. That fits Set 5 Quarter 2, when lesbians also reported the most hangovers. But we're talking less than half a night a month between the groups.
The guesses are the real story again. Each identity group guessed for its age peers:
• Lesbians guessed 3. Real: 1.6.
• Queer users guessed 3.1. Real: 1.5.
• Bisexual users guessed 3.3. Real: 1.2.
The group that parties the least gave the highest guess. Hold that thought for the end.
So why does everyone think everyone else is out every weekend? It's the visibility problem from Set 7 Quarter 3. You don't see your friends' nights in. You see the one night they went out, on their story. Thirty stories from thirty different people on thirty different Saturdays add up to "everyone is out every weekend." Really, each of them went out once.
There are also fewer places to go. In 1980, there were more than 200 lesbian bars in the U.S. When the Lesbian Bar Project launched in 2020, it counted 15. The good news is the count is back up to 36. That's still fewer than one per state. Americans in general also spent about 30% less time socializing face-to-face in 2022 than in 2003, and for teenagers the drop was more than 45%. Diva Magazine ran a whole piece last year titled "Queer club culture isn't dead," which, okay, is something you only have to say out loud when people keep insisting it is.
And yet the parties still matter. An Autostraddle essay about a Brooklyn lesbian night put it best: "the lesbian party is the only place where our sexuality is the least interesting thing about us."
One more connection. In Set 9 Quarter 1, the two groups with the fewest close sapphic friends were the 40s+ (3.3) and bisexual users (2.6). This week, those are the two groups going out the least. Friends and nights out tend to show up together. If you want more of one, try the other.
🧵 The Thread
Here's what the typical sapphic's month actually looked like, according to Set 9 Quarter 2:
YOUR MONTH, WRAPPED Nights out: 1.5 Days on the phone with a parent: 11.5 Chance you've dated someone 5+ years older or younger: about a coin flip Chance you love going down on her: 87% Top genre: Stayed in, called home, very generous in bed
And here's what we guessed that month looked like: twice as many nights out, fewer calls home, a quarter of us lukewarm about oral, and late teens all over age-gap relationships.
That's the stereotype version of us. The party girl who doesn't talk to her family, with the girlfriend fifteen years older, who'll go down on you only if you ask nicely. Nearly every big miss this week leaned toward that version. In Set 8 Quarter 3, I said this community keeps imagining itself as more damaged than the data shows. This week we imagined ourselves messier, more estranged, and less into each other. Same mistake.
And this week the gap between the stereotype and the truth was biggest for bisexual users, and bisexual users were the ones guessing it. They gave the highest guess on how many of their own group don't enjoy going down on women (27%, real 9%) and the highest guess for how often everyone goes out (3.3, real 1.2). Across all of Set 8, the community kept guessing bi users were messier than they turned out to be. In Set 9 so far, bi users are the least likely to wake and bake, the least likely to go out, the most likely to call home, and the most enthusiastic in bed (small group, big energy). This time they're guessing themselves into that stereotype. Babes. Look at your own data.
The one group that missed in the other direction was the 40s+. They thought 58% of their peers had done the age-gap thing. It was 80%. Twice in two Sets now, the people with the most history are the ones underselling it.
So here's the real typical sapphic of Set 9 Quarter 2. She went out once this month. She called home a few times a week. There's a coin-flip chance she's dated someone five-plus years older or younger. And she genuinely, enthusiastically enjoys going down on you.
Honestly? That's hotter than the stereotype.
XOXO SapphicSavvy
P.s. here's some additional reading if you're so inclined:
Mind the Gap:
• https://www.census.gov/library/stories/2023/08/same-sex-married-couples-age-race-ethnicity.html
• https://www.census.gov/content/dam/Census/library/working-papers/2023/demo/sehsd-wp2023-10.pdf
• https://www.autostraddle.com/4-questions-to-ask-yourself-when-entering-an-age-gap-relationship/
• https://www.autostraddle.com/mind-the-age-gap-how-to-deal-with-may-december-lesbian-relationships-131564/
Call Your Mother:
• https://www.pewresearch.org/social-trends/2024/01/25/young-adults-relationship-with-their-parents/
• https://www.pewresearch.org/social-trends/2013/06/13/chapter-3-the-coming-out-experience/
• https://www.sciencedaily.com/releases/2022/12/221215104549.htm
• https://www.census.gov/library/stories/2023/03/losing-our-parents.html
Lip Service:
• https://www.autostraddle.com/how-do-lesbians-have-sex-288982/
• https://www.autostraddle.com/what-is-a-dental-dam-387599/
• https://www.sexandpsychology.com/blog/2018/1/26/do-men-and-women-find-giving-and-receiving-oral-sex-equally-pleasurable/
• https://link.springer.com/article/10.1007/s10508-017-0939-z
Party of One (Point Five):
• https://www.autostraddle.com/every-lesbian-bar-in-the-us/
• https://www.autostraddle.com/whats-the-point-of-lesbian-parties-339270/
• https://diva-magazine.com/2025/04/16/queer-club-culture-isnt-dead/
• https://news.gallup.com/poll/713534/americans-drinking-remains-record-low.aspx
• https://www.theringer.com/2024/02/27/pop-culture/why-americans-stopped-hanging-out-why-it-matters-teenager-loneliness