Set 9 - Quarter 1
🌅 Bongs, 🤖 Bots, 📱 Blue Lights, and 👯♀️ Besties

Hello from SapphicSavvy!
Set 9 is officially underway, which makes this the second-to-last Set of Heat 1. The finish line is visible from here. Play your rounds.
This week: morning weed, chatbots, screen time, and your friends (the ones you haven't slept with). Let's go
🌅 Rise and Grind(er)
About 21% of you waked and baked at least once in the past month.
One in five. Before breakfast. Some of you had a bowl before you had a bowl of cereal.
Y'all guessed 32%, though. So as much as we like a morning sesh, we think everyone else is having a lot more of them.

Late teens 15%, 20s 26%, 30s 21%, 40s+ 20%.
The 20s lead, which surprises exactly no one. The 30s and 40s+ are basically tied at one in five, and honestly, the 40s+ holding steady here is kind of iconic. They take three supplements a day (Set 8 Quarter 4) and apparently one of them is a pre-roll.
Now the guesses. This question asked about your own age group, so this is the chart where it gets personal. Every age group overestimated its peers:
• Late teens guessed 34%. Real answer: 15%.
• 20s guessed 37%. Real: 26%.
• 30s guessed 30%. Real: 21%.
• 40s+ guessed 28%. Real: 20%.
The late teens missed by almost 20 points, the biggest miss of the week. They think more than twice as many of their friends are waking and baking as actually are. Remember Set 3 Quarter 3, when the youngest users wildly overestimated how many of their peers smoke or vape? I blamed the high school bathroom then and I'm blaming it now. You see the three kids who show up to first period smelling like a Grateful Dead concert. You don't see the thirty who just had toast.
Also, a reminder that most of our late teens can't legally buy weed yet. So, 15%. Sure. We'll allow it.
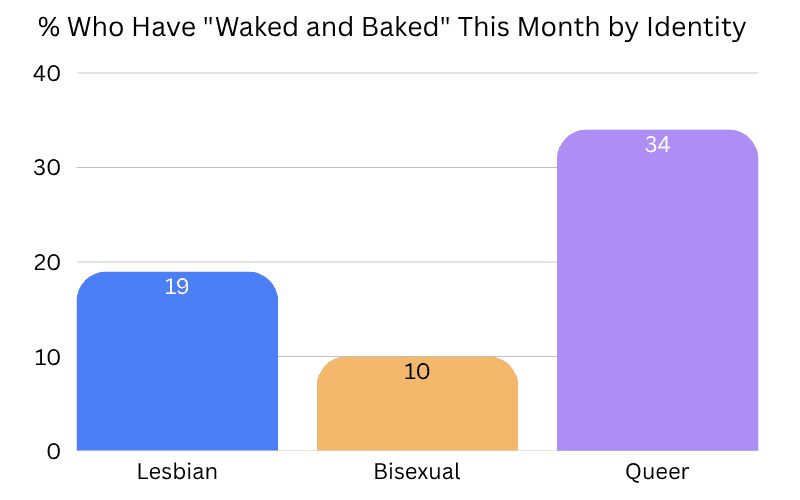
Lesbian 19%, bisexual 10%, queer 34%.
Queer users lead by a lot, which lines up with Set 3 Quarter 2, when queer users were also about 10 points ahead of everyone else on getting high at least once a week. Consistent girlies.
And here's my favorite detail. The question asked each of you to guess for your age group, not your identity group. Queer users guessed 34% for their peers. Their own rate? 34%. Lesbians (19% themselves) guessed 32%. Bisexual users (10% themselves) guessed 29%.
So queer users looked at their own mornings and assumed everyone else's looked the same. Psychologists call this the false consensus effect. I call it "everybody I know does this." It happens to be a very good guessing strategy when you're the group that actually does it.
Bisexual users are the lowest at 10%, which is interesting, because in the research it tends to go the other way. One 2024 study of young adult women found past-month cannabis use of 27% for straight women, 43% for lesbians, and 54% for bisexual women. Our bi users are not following the script. (We also only had 29 bisexual players this round, so I'm holding this one loosely.) But it fits a pattern from the entire last Set, and we'll come back to it.
For national context: in the 2024 National Survey on Drug Use and Health, 15.1% of Americans 26 and older used cannabis at all in the past month. Our 30s and 40s+ are at 21% and 20% for using it before noon. Among 18 to 25 year olds nationally, past-month use of any kind was 24.1%. Our 20s beat that with the morning crowd alone.
And back in Set 3 Quarter 2, about 40% of you said you get high at least once a week. If that still holds, a big chunk of the weekly crowd is starting the day with it.
Sincere beat, on purpose, because this one's close to home for us: when you use matters, not just how much. A 2016 study literally titled "Don't wake and bake" found that daily users who used in the morning had more cannabis-related problems than daily users who waited, even after accounting for how much they used. A more recent study that followed young adults in Seattle for two and a half years found that the more months someone used in the morning, the more cannabis use disorder symptoms they had down the line. Researchers mostly read morning use as a sign of heavier use overall, which makes it a pretty good early warning light. If that's you, no judgment. It's just worth noticing. There are resources in the app's support section if you ever want to take a closer look at your use.
🤖 Artificial Intelligence, Natural Skepticism
The typical user intentionally uses AI about 1.7 days a week.
Intentionally is doing a lot of work in that question. Every Google search now comes with an AI summary nobody asked for, so the honest answer for a lot of us is "seven days a week, against my will." We asked about the times you actually chose it.
Y'all guessed 2.4 days. Every age and identity group overestimated this one.

Late teens 1.2, 20s 1.0, 30s 2.1, 40s+ 2.4.
That's right. The oldest group uses AI the most, and the 20s use it the least. That's the opposite of the country. Pew surveyed Americans this February: 31% of 18 to 29 year olds and 34% of 30 to 49 year olds use an AI chatbot every day. For 50 to 64 year olds it's 19%, and for 65+ it's 7%.
Nationally, the younger you are, the more you use it. In this app, it runs the other way. I think I know why, and it goes back to last Set. In Set 8 Quarter 1, our 20s were the most worried about AI of any group in the dataset: 97% more concerned than excited. In Set 8 Quarter 4, the 20s put the odds of AI ending humanity in the next ten years at 48%. You don't cozy up to the thing you think has coin-flip odds of killing you. The 20s are boycotting the apocalypse.
Meanwhile, the 30s and 40s+ were the calmest groups both times, and now they're the heaviest users. My guess is the 40s+ are using it the way they used Google in 2004. "How do I make a spreadsheet do the thing." "Write this email so it sounds nice but I'm furious." "Is this mole normal." (Please ask a doctor about the mole.)
The guesses by age were also off, and all in the same direction. The 20s guessed 1.8 days for their identity group. They're at 1.0 themselves. The 40s+ guessed 2.9. They're at 2.4. Everyone thinks the rest of us are more hooked than we are.

Lesbian 1.8, bisexual 2.2, queer 1.3.
And here's the pattern I promised. Bisexual users use AI the most. In Set 8, they had the lowest AI concern of any identity group (Set 8 Quarter 1) and gave by far the lowest odds of AI ending humanity (23.7%, Set 8 Quarter 4). The calmest group is also the one most willing to actually use the thing. That's consistent, at least. Bisexual users also had the most accurate guess of the three: 2.4 guessed for themselves, 2.2 actual.
Queer users use it least, at 1.3, and guessed 2.0. Queer users also led the pack on arts, crafts, and theatre over sports (over 90%, Set 6 Quarter 2). A group made of that many artists, writers, and theatre kids was always going to side-eye the robot that learned to paint by scraping everyone's portfolio.
One more nuance. The spread on this question was huge, and the standard deviation was bigger than the average itself. That usually means a lot of people sitting at or near zero and a smaller group using it most days. The "typical" user at 1.7 days is kind of an average of two camps. Nationally, Pew also found women are less likely than men to use chatbots daily (20% vs. 27%) and more likely to say AI is moving too fast (68% vs. 58%). A community of women and gender-expansive folks who were very worried about AI last Set is using it less than we assumed. That checks out.
📱 Your Weekly Screen Time Report Is Ready
87% of you wish you spent less time on your phones.
You told us this through an app. On your phone. We see the irony. We're choosing to move past it.
Now, the guesses. Y'all guessed 68%. That's almost 20 points too low, and it's the only question this week where we underestimated. Every single age and identity group guessed too low.

This is basically a flat line of regret. Nobody's immune.
Compare that to the country. A Pew survey released this month (more than 9,700 adults) found 53% of Americans say they spend too much time on their phones. By age, it drops fast: 70% of 18 to 29 year olds, 64% of 30 to 49, 49% of 50 to 64, and just 25% of people 65 and older. (Pew asked if people spend "too much time," and we asked if you wish you spent less, so it's not a perfect match. But it's close.)
In this app, the age drop-off barely exists. Our 40s+ are at 89%. Nationally, around half of people 50 to 64 feel that way. Our older users are not doing the "I just use it for the weather" thing. They're in it with the rest of us.
The biggest gap was also the 40s+. They guessed 65% for their identity group. They're at 89% themselves.

Lesbian 88%, bisexual 79%, queer 90%.
Queer users top it again, and bisexual users are lowest again (with the same small-sample caveat as before). Bisexual users also had the closest guess, 70% vs. 79%. Lesbians guessed 67% and are at 88%. Queer users guessed 69% and are at 90%.
So here's what happened. Nearly nine out of ten of you privately wish you'd put the phone down. And you assume most of your fellow sapphics are pretty fine with theirs. Psychologists have a name for that too: pluralistic ignorance. Everyone privately feels the same thing, and everyone assumes they're the exception. Think of a room full of people all quietly hating the song, and nobody asks to change it because everyone else seems to be vibing.
In fairness to the phone, it's also where a lot of queer life happens. A Trevor Project brief from last year found that 65% of cisgender LGBTQ+ young people (and 79% of trans and nonbinary youth) go online to connect with others because it's hard to do that in their daily lives. The phone is where the group chat lives, where you found the book club, and where this app is. So the question is how much of your screen time is the group chat, and how much is scrolling past strangers until 1 a.m.
Back in Set 4 Quarter 3, when we asked about meditating, I blamed "that damn phone" for my lack of mindfulness. Turns out 87% of you were quietly nodding.
👯♀️ Gal Pals (Platonic, For Real This Time)
The typical user has about 3.6 close, totally platonic sapphic friends. Exes not included, because we know y'all.
Y'all guessed 4.4. So once again, we think everyone else is doing a little better than we are.
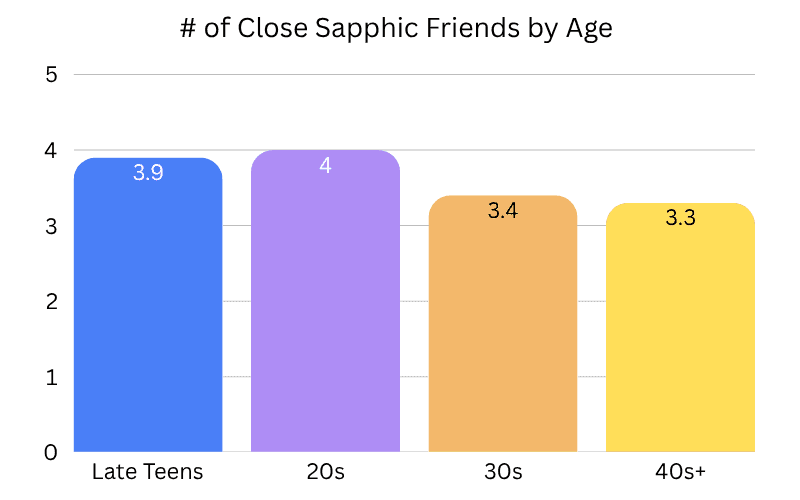
Late teens 3.9, 20s 4.0, 30s 3.4, 40s+ 3.3.
The late teens absolutely nailed this one. They guessed 3.8 for their age group, and the real answer was 3.9. After whiffing by 20 points on wake and bake, the youngest users came back and got this one right. Redemption arc.
The 40s+ went the other way. They guessed 4.8, the highest guess of any group, and have the fewest at 3.3. That's the biggest miss on this question.
This one's interesting because nationally, it's the opposite. In Pew's 2023 friendship survey, 49% of adults 65 and older said they have five or more close friends, compared with 32% of adults under 30. Older Americans have more close friends. Our older users have fewer close sapphic friends.
A few theories:
We told you not to count exes. In Set 5 Quarter 4, we saw that staying friends with an ex was less common among our younger users. Which means the older you are, the more likely your friend group includes a few women you used to date. We just took those people out. Honestly, the "(do not include exes!)" clause may have cost the 40s+ a friend
or two.The spaces closed. The Lesbian Bar Project says there were about 200 lesbian bars in the U.S. in the 1980s. By 2020, there were 15. A lot of the places where sapphic friendships used to form just aren't there anymore. The 20s have Discord servers, run clubs, and group chats named after inside jokes. (And this app. Hi.)
Life happens. Coupling up, moving, jobs, kids. Sapphic friendships don't end, they just go from weekly to "we should really get dinner."

Lesbian 3.8, bisexual 2.6, queer 3.6.
Bisexual users have about one fewer close sapphic friend than lesbian and queer users. Some of that is probably just math. If you date across genders, your social circle likely does too, and plenty of your close friends aren't sapphic. But some of it may be about whether bi women feel fully welcome in lesbian-heavy spaces. We've talked about that before, and it's still worth saying: sapphic friendship is for all of us.
Bisexual users guessed 3.7 for their age peers. So they think everyone else their age has about one more sapphic friend than they do. Lesbians (3.8) guessed 4.5, and queer users (3.6) guessed 4.4. Everyone thinks the other girls have a bigger friend group.
Quick national context: in the Survey Center on American Life's 2021 friendship survey, 49% of Americans said they have three or fewer close friends, up from 27% in 1990, and 12% said they have none. Our users have an average of 3.6 close friends who are specifically sapphic, not counting exes, straight friends, coworkers, or the barista who knows your order. That's not a small number.
Also, to whoever reported 25 close, platonic, sapphic friends: that's not a friend group. That's a softball league. We're very happy for you.
The Thread
Put the four guesses side by side:
• We thought more of our peers wake and bake than actually do (32% guessed vs. 21%).
• We thought people use AI more than they do (2.4 days vs. 1.7).
• We thought people have more sapphic friends than they do (4.4 vs. 3.6).
• And we thought fewer people wish they were off their phones (68% vs. 87%).
That's the same mistake four times. We picture everyone else as having more fun, more tools, more friends, and more peace with their phone than we do.
And I think the phone is exactly why. That's where we see each other. The feed shows you the stoner memes, the AI screenshots, and the girl whose birthday dinner has fourteen people at it. It doesn't show you the 79% who just had toast, the 20s averaging one AI day a week, or the 87% who wish they'd put the thing down an hour ago. Set 7 Quarter 3 called this the visibility problem: we build our picture of the community from the slice we can see. This week, the slice we can see comes to us through a screen that almost all of us wish we looked at less.
So here's this week's assignment. Text one of your 3.6 friends. Make a plan that doesn't involve a screen. Then put the phone face down and go do the plan.
(After you play this week's round. We're not that self-sacrificing.)
XOXO SapphicSavvy
P.s. here's some additional reading if you're so inclined:
Wake and Bake:
• https://www.tandfonline.com/doi/abs/10.1080/16066359.2016.1177027
• https://pmc.ncbi.nlm.nih.gov/articles/PMC10919896/
• https://pmc.ncbi.nlm.nih.gov/articles/PMC11225982
• https://www.autostraddle.com/high-femme-queer-cannabis-culture-185354/
AI Use:
• https://www.pewresearch.org/internet/2026/06/17/how-opinions-and-use-of-ai-differ-by-age/
• https://www.pewresearch.org/internet/2026/06/17/the-gender-gap-in-ai/
Phone Time:
• https://www.pewresearch.org/short-reads/2026/09/01/about-half-of-americans-say-they-spend-too-much-time-on-their-smartphone/
• https://www.thetrevorproject.org/research-briefs/online-experiences-and-mental-health-of-lgbtq-young-people/
Sapphic Friendship:
• https://www.pewresearch.org/short-reads/2023/10/12/what-does-friendship-look-like-in-america/
• https://www.americansurveycenter.org/research/the-state-of-american-friendship-change-challenges-and-loss/
• https://gomag.com/article/queer-women-redefining-friendship/
• https://www.autostraddle.com/the-lesbian-bar-project-raises-over-100000-to-protect-15-of-our-last-lesbian-bars/