Set 7 - Quarter 4
Men, Months, Meds, & the Ones That Got Away

Set 7 is officially closed, and MISCHIEFPX just won $500 for being dead on in their guesses about the typical sapphic experiences for basically an entire month. Truly blown away by how good some of you all are at this game (especially you lesbians in your 20s). Set 8 kicks off this week and we've got three more Sets left in Heat 1, so if you've been lurking in the results posts and never actually playing, this is the part where I gently point out that you're leaving money on the table.
This week's questions were a bunch of user-submitted ones about sex, breakups, and pharmaceuticals. No unifying theory here but I have four separate theories and a lot of opinions. Let's go.
Male Friend Math 🧮
We asked how many male friends the typical user has, and I want to note that this question generated the most immediate suspicion of anything we've run in a while. Several of you clearly read it as a test. It was not a test. There is no correct number of men.
The overall average landed right around 3.4.
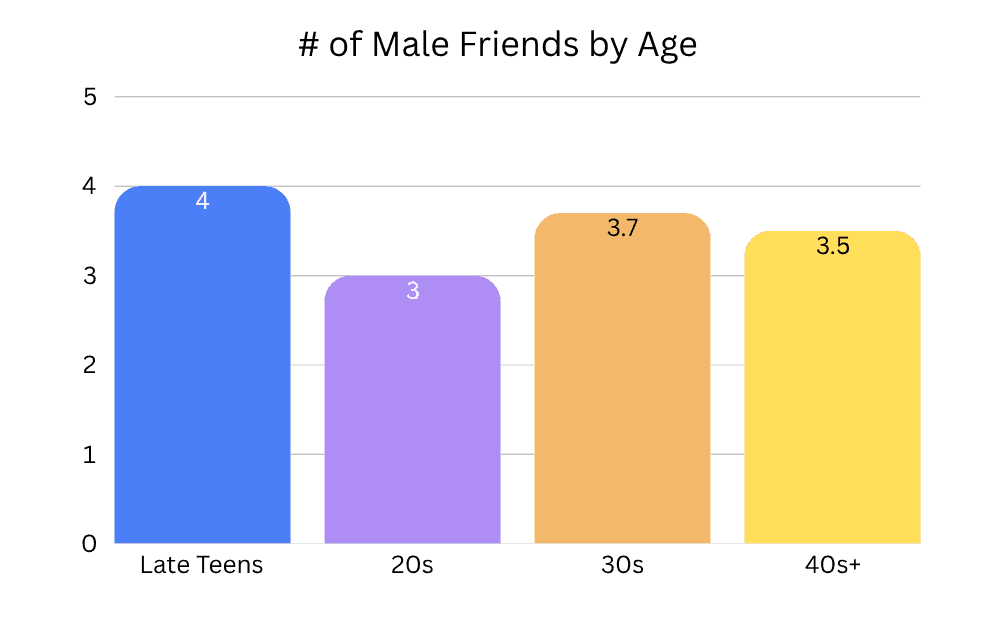
So it dips and recovers, which is a pattern and not a trend, and you know how much I enjoy those.
Here's my read on the dip. In your late teens, you do not select your friends. Proximity selects them. A seating chart, a dorm floor, a shift schedule, a group project — you end up with whoever was standing there, and a meaningful share of whoever-was-standing-there is men. Then you graduate into a world where friendship becomes elective for the first time in your life, and a lot of sapphics in their 20s look at the roster and start making cuts. Set 4 Quarter 3 found over 60% of you dislike most cis straight men, with younger users highest of all. The 20s are when the preference finally gets to express itself in the actual guest list.
Then it climbs back. Not because anyone changed their mind about men, but because your 30s hand you a workplace, a partner with a brother, a climbing gym, a group chat that formed around a shared enemy. Adult life re-mixes you whether you asked to be re-mixed or not. There's also a brutal attrition effect running underneath: by your 30s, the friendships you have are the ones that survived, and some of the survivors are men.
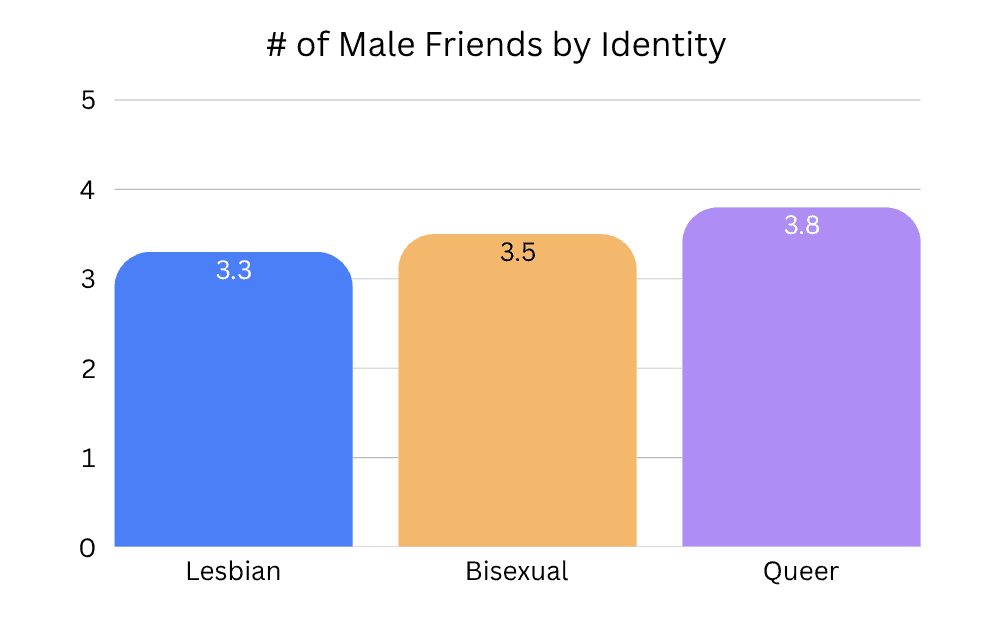
Everyone is now expecting me to say "and this is because lesbians hate men," so let me not. It's half a friend. Half a friend is not a worldview. What I actually think is happening is that "male friends" is doing sneaky work as a category, because a queer user's male friends are much more likely to include gay men, trans men, and people generally living somewhere adjacent to our whole situation. That's not a bigger tolerance for men. That's a bigger, mixier queer social world, and it's showing up as a number about men because that's the only box we gave you. My fault, sorry.
DIVA ran a piece on this exact question last year that put it about as well as it can be put — that a real part of lesbianism is <cite>learning to decenter men</cite>, which makes seeking them out for companionship less appealing rather than actively offensive. And Autostraddle has been writing for over a decade about the specific relief of finally building a queer friend group after years of being the chill token bisexual in a room of guys asking invasive questions. That's not a grudge. That's a preference, earned.
Now for the part that reframes the whole chart. Pew found in 2023 that 66% of U.S. adults say all or most of their close friends are the same gender, and for women that jumps to 71%. Dunbar's research is even starker: roughly 80% of women's best friends are other women, and that ratio holds rock-steady across every decade of life. Meanwhile the Survey Center on American Life clocks the average American at somewhere around two to three close friends total, with 17% reporting none at all as of 2024. The bottom line: our users report more male friends than the average American reports total friends. In the middle of a documented national friendship recession. Whatever we're doing socially, we're not doing it alone, and we're apparently not doing it only with fellow sapphics.
One last thing, and I'm putting it here because it's my favorite fact of the week. There's a well-cited 2003 study by Heidi Reeder finding that women who score lower on conventional femininity have a significantly higher proportion of cross-sex friendships. Back in Set 7 Quarter 1 we found a large majority of you self-identified as tomboys growing up. So if you were the kid on the boys' team, you probably kept a couple of them. Congratulations on your childhood, it's still on your phone.
Dry Spell Dispatch 🌵
Next: what percentage of users have NOT had sex with a partner in the past month. Overall, right around 47%. Before anyone spirals: this is a one-month window, not a lifetime assessment, and roughly half of every group is in it with you.
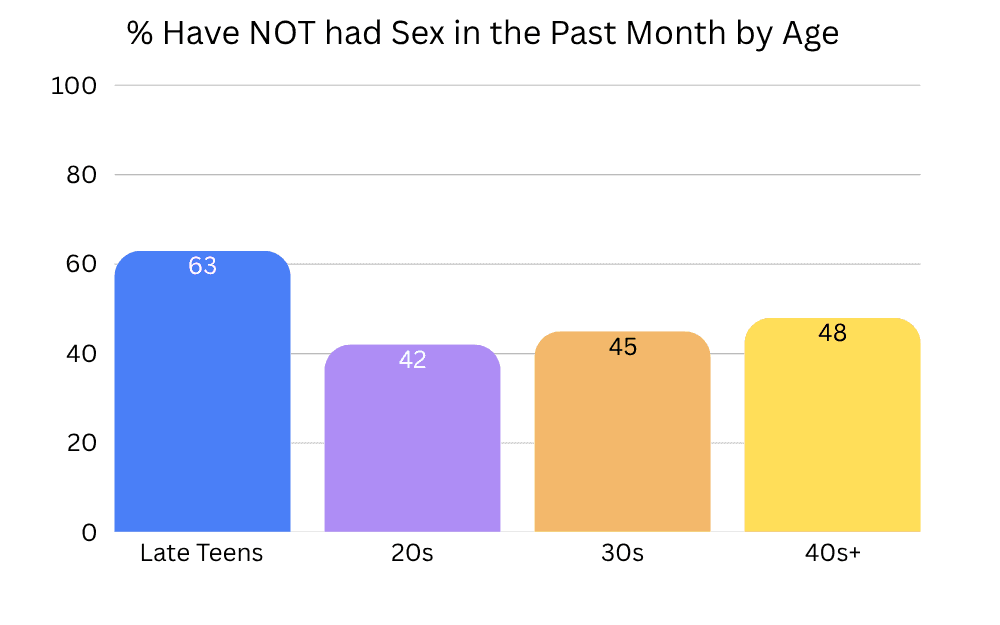
The teens are the outlier and also the least surprising number in the entire dataset. Set 3 Quarter 2 put the average coming-out age around 19, which means a big chunk of that group is pre-. They live with parents, or with a randomly assigned roommate, or in a town with a sapphic population of four. A dry month at nineteen isn't a drought, it's a prologue.
What's actually interesting is how flat the rest of it is. 42, 45, 48. No cliff. No collapse. Which is worth sitting with, because Set 3 Quarter 4 found over half of you have been in a relationship that went sexless over time, and the bed death discourse would have you believe the line should fall off a table somewhere around 35. It doesn't. Bed death is real as an experience — it just isn't a demographic destiny.
Now the national picture, and buckle up, because it's bleak out there. The General Social Survey found that in 1990, 55% of American adults 18–64 were having sex weekly. By 2024 that was 37%. Among 18–29 year olds, the share reporting no sex in the past year doubled from 12% in 2010 to 24% in 2024. Researchers have named this the sex recession, which is a phrase I resent and will now use constantly. Direct comparison is tricky because our window is a month and theirs is a year, so read it as a vibe check and not a scoreboard. But the vibe check comes back fine. We are not a community in special crisis. We're in the same national dry spell as everyone else, possibly with better hydration.
The most-cited explanation for the recession, by the way, is almost aggressively unromantic: the single biggest predictor of having sex is whether you live with someone. Not chemistry, not apps, not vibes. Cohabitation. Which we literally asked about back in Set 7 Quarter 2, so this question may be measuring your lease more than your libido.
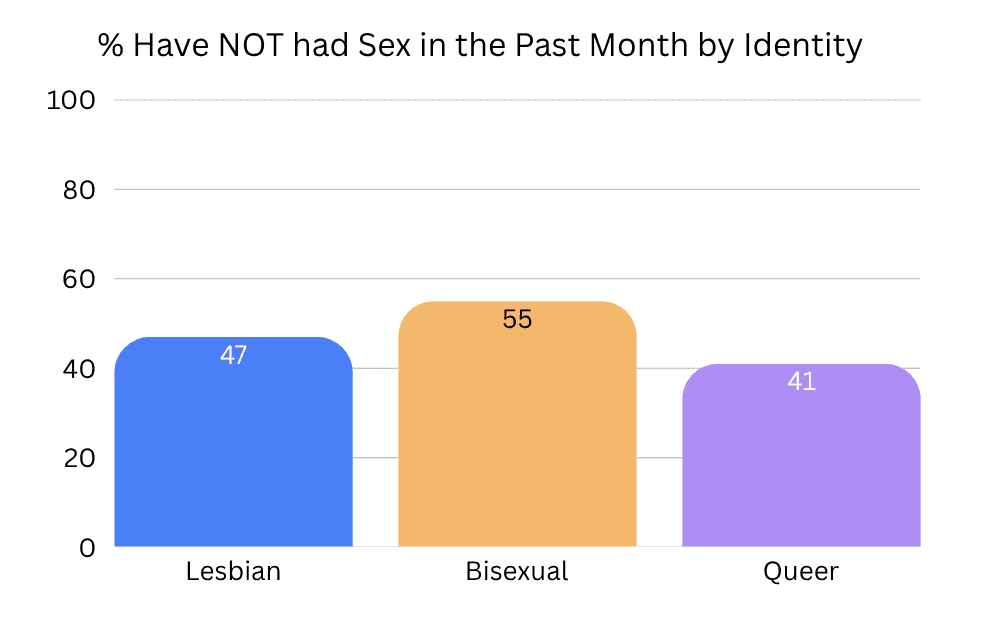
And here's where I have to point at something. Back in Set 6 Quarter 3, bisexual users reported the highest rate of ever having had three or more orgasms in a single session — 73%, by a wide margin, blowing past every other group. This week bisexual users report the highest rate of not having had sex in the past month.
I am choosing to read this as a quality-over-quantity operation. Bisexual users are not running a volume business. They are running a boutique. Fewer sessions, extremely high production values. Respectfully, the rest of us should be taking notes rather than counting.
Queer users at 41% continues a streak so long it's becoming a running joke in my notes — highest camping trips (Set 6 Q4), highest situationships (Set 5 Q4), highest sexual partners (Set 6 Q2), highest 12+ hour first dates (Set 3 Q4).
Long-Haul Losses 🕰️
We asked for the length, in months, of your longest relationship that ended in a breakup. Read that wording again, because it matters: this is a personal record, not an average. You're looking at a hall of fame, not a batting average.
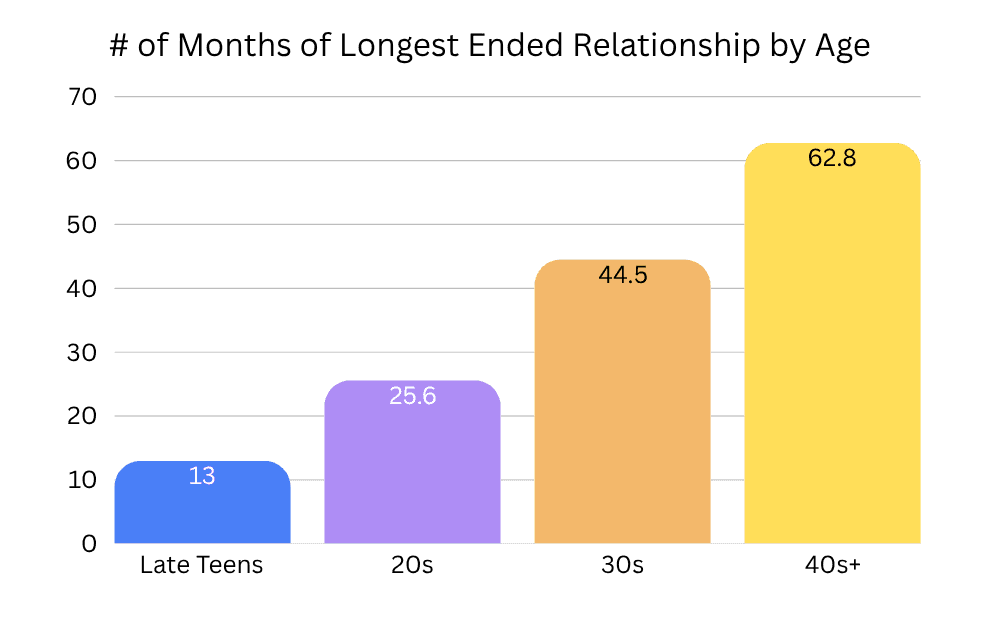
The obvious point first: this is the most mechanically determined chart we have ever published. You cannot have had a five-year relationship end if you have only been dating for three years. Time is a hard ceiling and the chart is mostly a picture of the ceiling. But the shape is where it gets good. Teens to 20s roughly doubles. 20s to 30s adds about 19 months. 30s to 40+ adds about 18. It's flattening. If this number grew purely as a function of years available, the 40+ bar should be running away from everybody, and it isn't.
Here's what I think that plateau is. By your late 30s, the long relationships you're in are increasingly the ones that don't end. The eight-year one is still going. The twelve-year one is still going. They never enter this dataset, because we only asked about the ones that broke. So the ceiling stops rising not because sapphics in their 40s have shorter relationships but because their longest ones are still in progress and therefore ineligible. Which means this chart isn't a record of failure. It's a record of what you walked away from, and it flattens out right around the age where the good ones start sticking. I did not expect to find that comforting and yet.
For scale: 62.8 months is 5.2 years. That is a long relationship to have survived the end of. And when you stack it against Set 5 Quarter 1, where the typical first sapphic heartbreak took about a year to get over — in your 20s you're serving roughly two years in and one year out. A two-to-one sentence. Time off for good behavior not available.
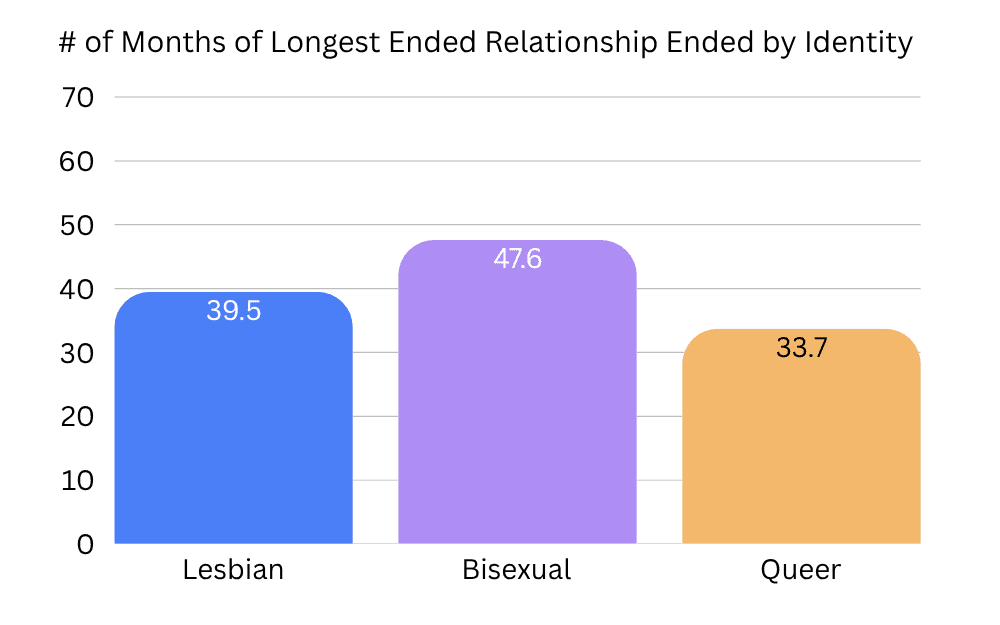
Before anyone builds a theory of relationship quality out of this: the identity groups have different age distributions, and this question is basically a stopwatch. Set 3 Quarter 2 found queer users come out youngest and the queer label skews younger overall. A younger group will post a lower number on a question that mechanically rewards having been alive longer. That's most of the gap right there, and I'd be lying if I dressed it up as anything more interesting.
The bisexual number does have one real thing going on, though. For a lot of bisexual users, the longest relationship that ended isn't necessarily a sapphic one. It might be a long relationship from a different chapter, possibly pre-coming-out, possibly with a man, and possibly one that lasted a long time precisely because leaving it required figuring something out first. We ran into the same mechanism back in Set 4 Quarter 4, where bisexual users were less likely to have come out to a doctor partly because relevance depends on who you're currently with. Bisexual life doesn't sort neatly into our question wording. That's on the question, not on you.
For national context: research puts the median duration of a new romantic relationship at roughly 1.3 years for straight couples and 1.1 for same-sex couples, and surveys of dating adults tend to land around two years and nine months for relationships that eventually end. Our numbers run above that across the board, which tracks — we asked for your longest, and you gave us your longest. I'll also flag, because we don't do selective reporting here, that the Williams Institute's twelve-year study found women in same-sex couples were about twice as likely as men in same-sex couples and 1.5 times as likely as straight couples to have ended their relationships. That's a real finding and it's been sitting in the literature for years. Our data can't confirm or deny it, since we only asked about your personal record. But it's out there, and if you'd like to make the U-Haul joke, this is your legally designated window.
The Medicated Majority 💊
Last charts up, and they are flattest of the week and by far the biggest numbers.
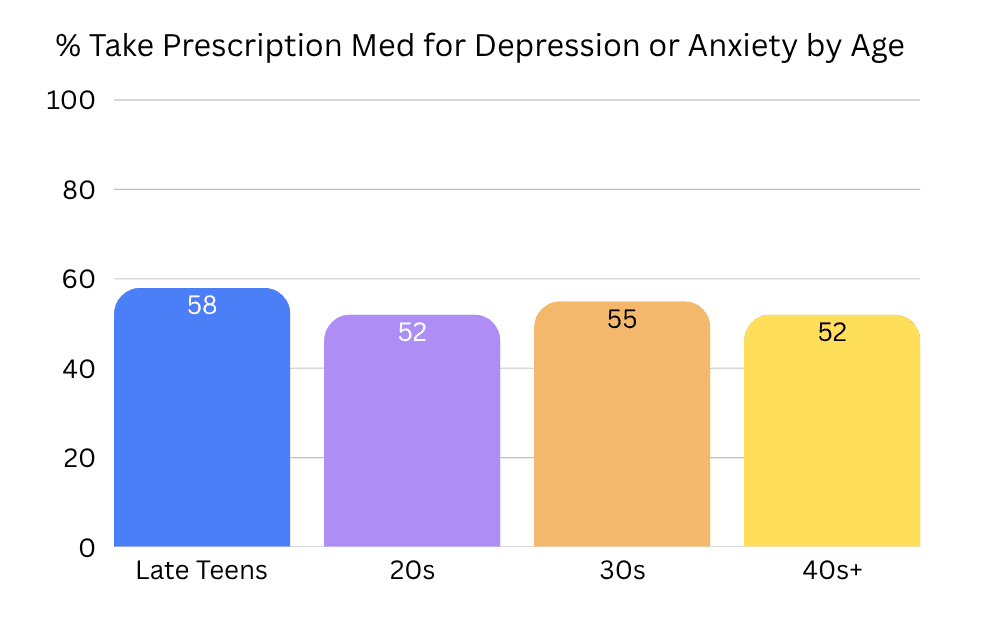
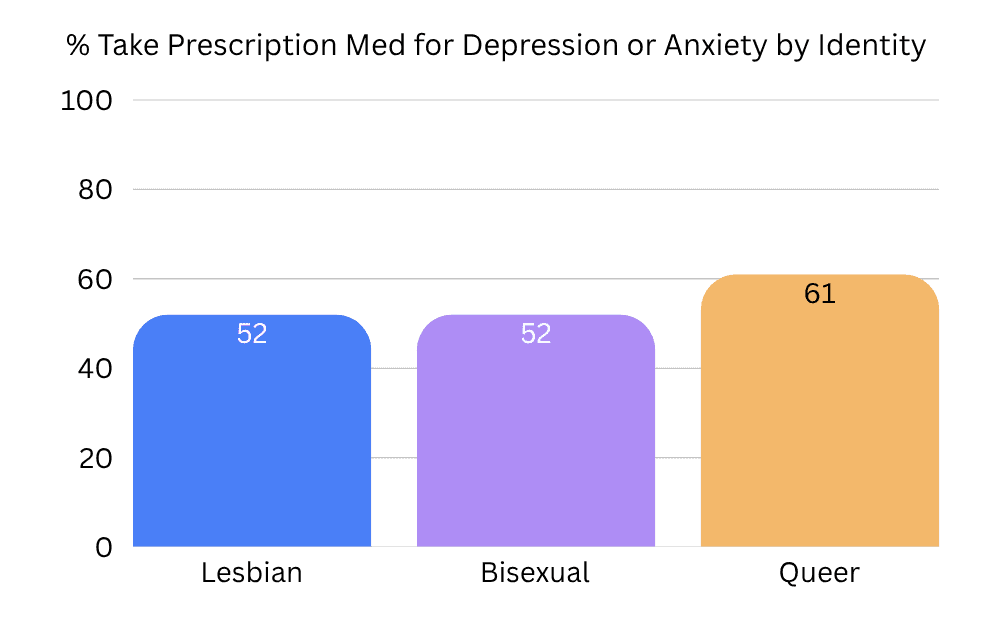
So: a majority of this community takes prescription medication for depression or anxiety. Every group. Every age. There is no generational split here at all, which is itself the finding — this is not a Gen Z thing that older sapphics are watching with concern from a distance. The 40+ number and the 20s number are identical.
Now the outside comparison, and it's a big one. Per the CDC's National Health Interview Survey, about 19.3% of U.S. adults took prescription medication in the past 12 months for depression, anxiety, or other mental health reasons. Roughly one in five. Narrow it to medication specifically for depression and it's 11.4% of adults, 15.3% of women.
We're at 52–61%. Call it three times the national rate.
That's a hell of a number and I think there are two true things sitting inside it, and I don't think they cancel each other out.
The first is that the stress is real and documented. Meta-analyses consistently find that lesbian, gay, and bisexual people experience depression and anxiety at roughly double the rate of straight people, and minority stress theory does the explaining: chronic exposure to stigma, rejection, and the low background hum of expecting it. We have receipts from our own data. Set 5 Quarter 3: 87% of you heard or saw a slur, joke, or nasty comment about LGBTQ people during Pride month. Set 6 Quarter 3: nearly 75% have been told your identity is just a phase. Set 4 Quarter 1: about 70% have at least one family member who voted for him. That is a load-bearing amount of weight and a prescription is an entirely rational response to carrying it.
The second is that this is also, straightforwardly, a success story. The research on sexual minorities and mental health treatment finds we don't just have higher rates of need, we have higher rates of seeking and getting care, partly because community norms here are actively pro-treatment. Nobody in this community makes it weird when you mention your psychiatrist or crash out about forgetting to take your wellbubu. We recommend providers to each other like restaurants. Set 2 Quarter 2 found about half of you in therapy at least monthly against a national figure closer to 28% of women in an entire year, and that number had almost no age gradient either.
You cannot tell from a percentage alone whether it's a wound or a bandage. In this case I'm fairly confident it's both, and the bandage part is not nothing. There are a lot of people out there who need this medication and don't have it. Access is the whole ballgame and this community is winning that particular one.
The late teens at 58% is the number I keep looking at. You could read that as alarming. I read it as early. Getting treated at eighteen instead of white-knuckling it until you're thirty-four is a genuinely better outcome, and it means somebody was paying attention. Queer users at 61% is a few points above the rest, and I'd guess that's partly age composition again and partly that the queer label carries a lot of gender-expansive folks whose stress load stacks rather than substitutes.
And now a sincere paragraph, on purpose, because I refuse to be cute about this one. Medication is one tool. It works better alongside others — therapy, sleep, people who know your business, movement if your body allows it. If you're on it: good. That took a phone call you probably didn't want to make. If you're not on it and you've been quietly wondering for a while whether you should be, that's worth a conversation with an actual prescriber, and we've got resources in the app's support section to help you find an LGBTQ-competent one. If cost or coverage is the obstacle — which for a lot of you it is — that's a real barrier and not a character flaw, and the directories below are a decent place to start.
That's Set 7 in the books. Congrats to our winners, thank you for telling this app about your prescriptions and your dry spells and your male friends, and I'll see you in Set 8.
XOXO SapphicSavvy
As always, additional reading for context lovers….
Male Friends & The Friendship Recession:
https://www.pewresearch.org/short-reads/2023/10/12/what-does-friendship-look-like-in-america/
https://diva-magazine.com/2025/08/11/why-arent-lesbians-and-straight-men-friends/
https://www.scientificamerican.com/article/can-men-and-women-be-just-friends1/
The Sex Recession:
Relationships & Breakups:
https://williamsinstitute.law.ucla.edu/publications/same-sex-relationship-dissolution
https://www.autostraddle.com/the-lifespan-of-a-lesbian-heartbreak-130370/
https://www.autostraddle.com/should-i-go-no-contact-with-my-ex/
Meds, Minority Stress & Getting Care: