Set 6 - Quarter 2
Body Counts, Bottoms, and Bedazzling Clubs
Hello from SapphicSavvy!
It’s been a hot one this week! Both the weather and the results for Set 6 Quarter 2 were turning up the heat. Let's do a quick temperature check and see how everyone matched up to the results this week!
Body Count Ballad
Let's start with the classic first-date-you-probably-shouldn't-ask-but-we're-asking-anyway question: how many sexual partners has the typical sapphic had in their lifetime? The overall average landed at 9.16, and y'all guessed low, coming in at 7.92. Close-ish! But we can do better.
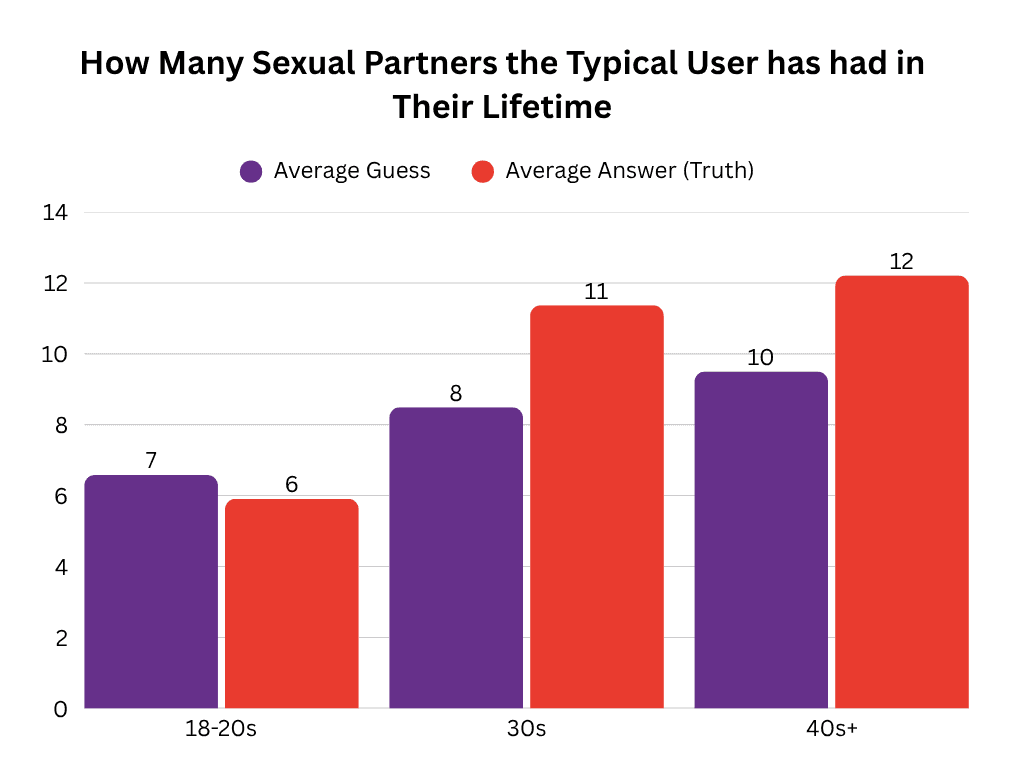
The age breakdown is where it gets fun. Users in their 20s reported an average of 6 partners, and this was the only age group where the guess (7) actually came in higher than reality. Everyone else undershot: 30s came in at 11 and 40s topped out at just over 12! Basically, the more candles on the cake, the more the number climbs, which tracks. More years out here means more opportunities to, well, meet people. Not to knock my own age group too hard, but there might be a little bit of a "main character syndrome" thing happening with younger users guessing higher than the actual average. I get it, when you're in the thick of your 20s, dating can feel like a lot is happening, but then I think back to whatever was happening on The Real L Word and realize that I’m tame compared to whatever they were on.
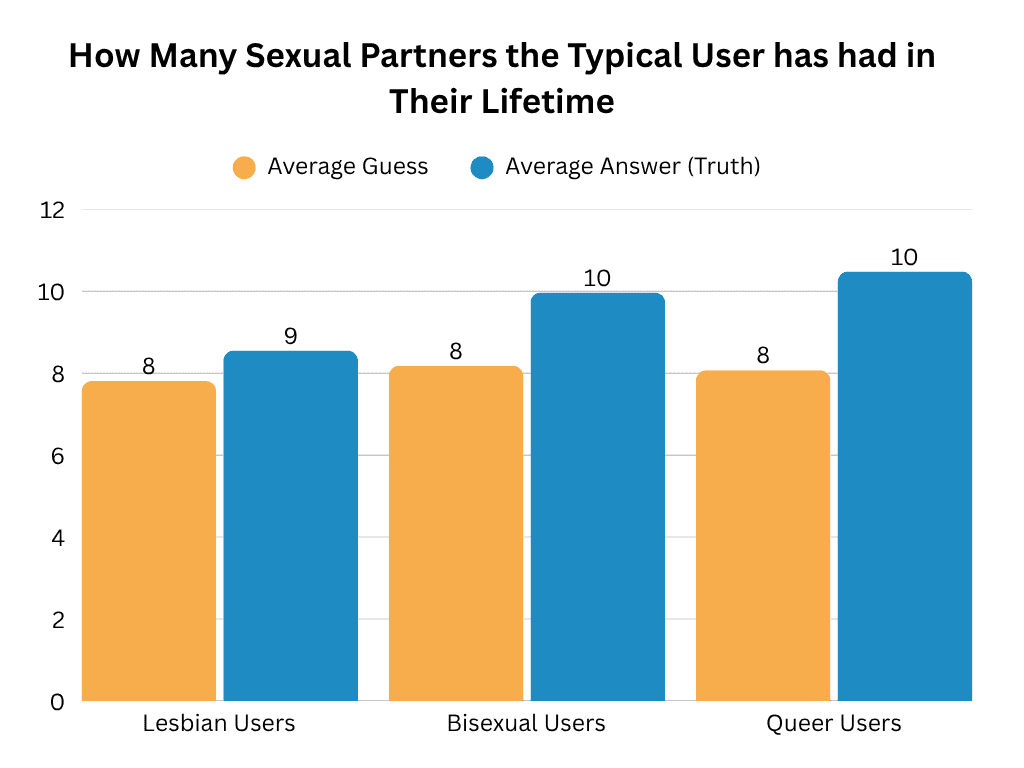
By identity, lesbians had the lowest average, followed by bisexual users, and then queer users, who topped the list at just under 11. This is a pattern we've seen before on SapphicSavvy, a wider dating pool (i.e., not being limited to dating other women exclusively) does seem to nudge the numbers up a bit. The numbers across groups were really similar though, and we think this is a good time to bust the unfortunate stereotype that bisexual people are "promiscuous" or have a lot more partners than other groups. Kinda seems like we all do similarly alright for ourselves! However many people you’ve hooked up with is no one else’s business anyways. We’re just airing out said business bc we’re nosy.
For context, national survey data (like the CDC's National Health Statistics Reports) has put lesbians' average lifetime partner count at somewhere around 7-8, compared to about 4 for straight women, so our numbers are landing in a pretty similar ballpark to previous research. Sapphics really are out here living it up a little more than the average, statistically speaking. Sapphic shortage whoooooo?
Jocks vs. Theatre Kids: SapphicSavvy Edition
Picture this, you’re back in HS (scary I know, but it’s just a thought exercise, bear with me). What table are we sitting at? Option 1: the classic nerds who are all in on academia; Option 2: the theatre kids who are belting Hamilton/Rent/Phantom of the Opera (or whatever was popular that decade); or Option 3: your [insert sport here] team. If you chose Option 2, you’re in extremely good company lol. Over 80% of users said they were more into arts/crafts/theatre than sports/athletics.
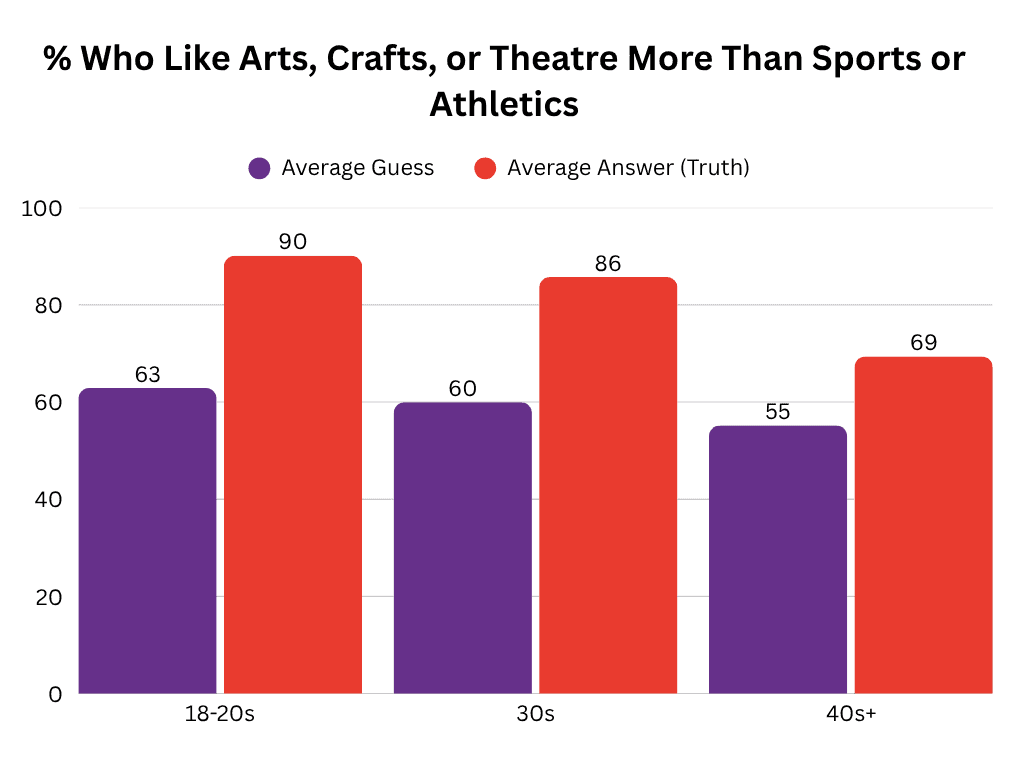
Pretty significant age trend here too. I get it, I was a victim of the Hamilton craze too. I even went so far as to major in theatre in college (shocker, for I am so well-adjusted and completely normal, I know). But trust that if you played sports you’re the MVP in our hearts <3
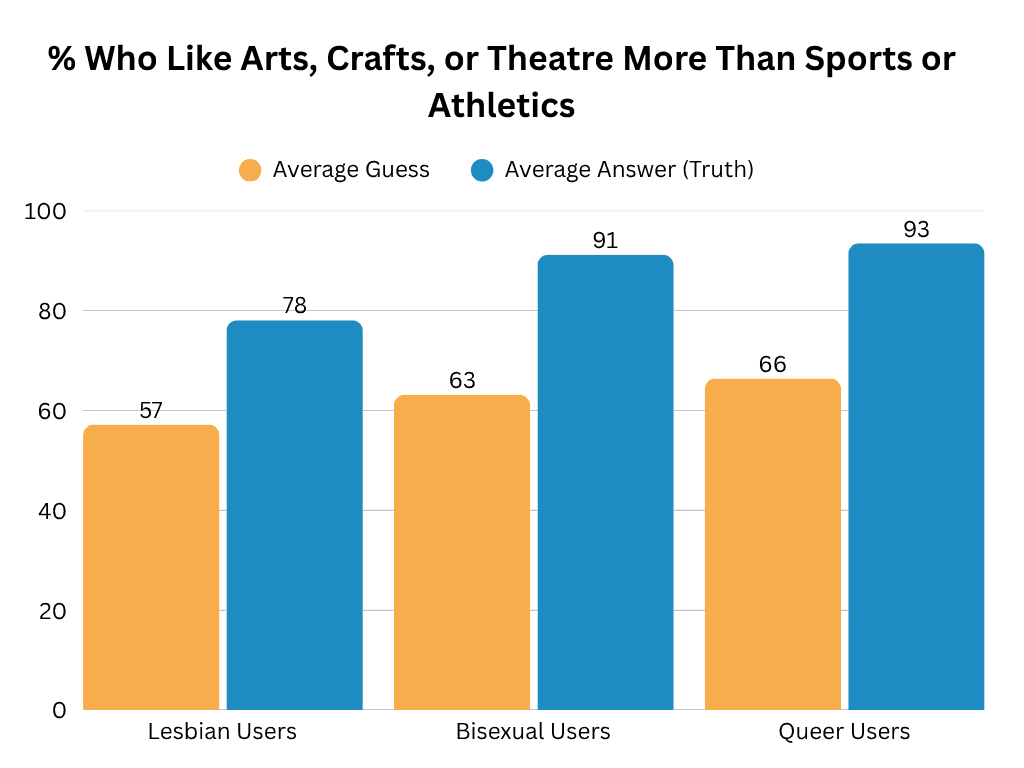
By identity, queer users led the pack at over 90%, followed closely by bisexual users. Lesbians came in comparatively lower (though still a majority) at just under 80%. We talked a few quarters back about varsity sports participation being surprisingly low across our user base (~25%, compared to a guessed 42%), and this feels like the natural sequel to that data point. So if anyone is hosting craft night anytime soon, drop the address plsss
Tops, Bottoms, and Everything In Between
O top, top, wherefore art thou top?
Deny thy label and refuse thy role;
Or, if thou wilt not, be but sworn my switch,
And I'll no longer ask if you're a top.
'Tis but thy category that is my enemy;
Thou art thyself, though not a top.
What's a top? It is not hand, nor mouth,
Nor any other part belonging to a lover.
O, be some other label!
What's in a label? That which we call versatile
By any other name would feel as good;
(that’s for you theatre kids btw)
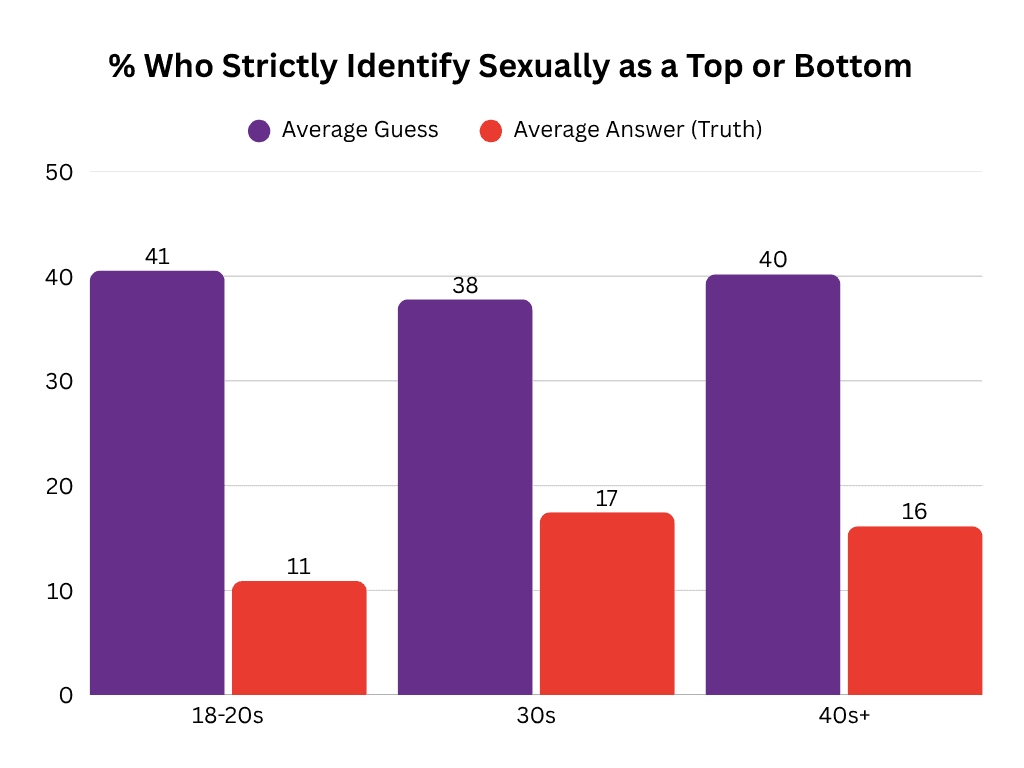
Labels are trifling little things. It seems like many of you agree, considering we had less than 15% of people say they identify strictly as a top or bottom. Where are my bad switches at 🤭
Small difference among younger users who are less likely to identify strictly as top or bottom, but I think this could either change with time or be a sign of times changed. I think labels can be useful, but are often limiting, and with something like our behavior in the bedroom, it can feel disingenuous to say we’re strictly one or the other. Which is a very bottom thing to say, I’m being told. Anyways.
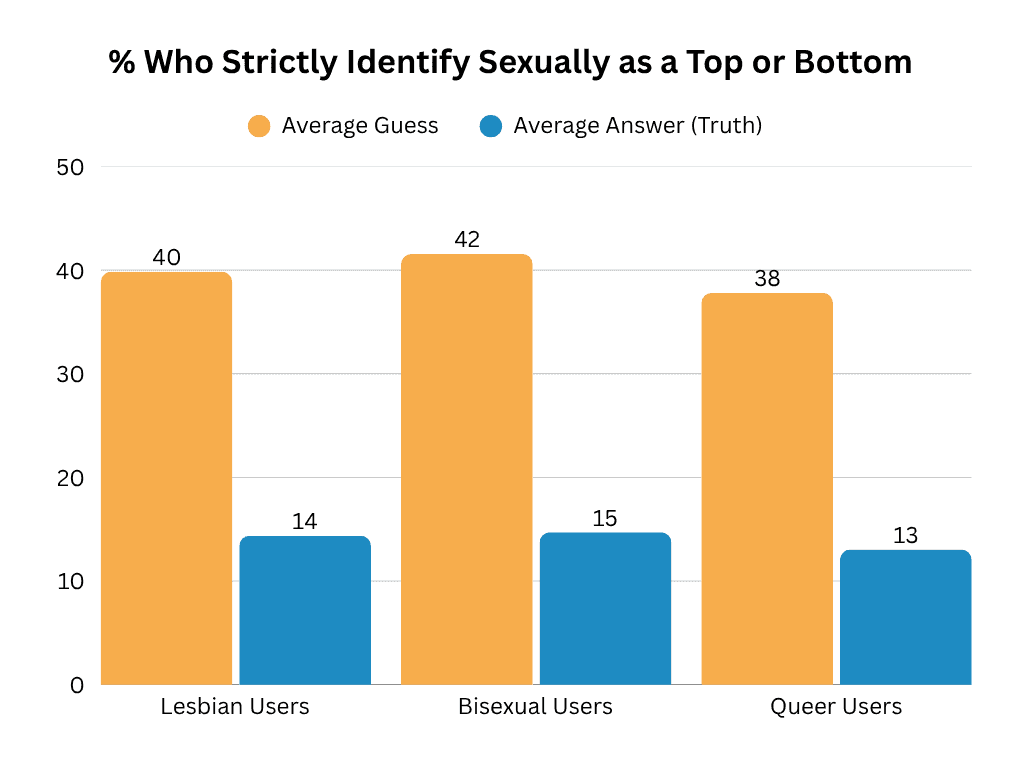
Pretty much zero difference across identity groups as well. So across the board, strict top/bottom identification is a minority position in this community, despite how much internet discourse would have you believe otherwise. We think this might say more about how loud a small, very online subset of any label can be than about what's actually typical. Versatile, switch, "depends on the person," and "I don't really think about it that way" are all doing a lot of quiet, unglamorous heavy lifting behind the scenes here. No labels are required to have great sex, but if a label works for you, that's valid too. You contain multitudes.
Dry-ish June?
Last but not least, we asked how many alcohol-free days the typical user had in June. The average came out to about 25 alcohol-free days (so most of us were drinking on about 5 days out of the month, give or take). The average guess was a lot lower though, sitting at about 19 days (11 drinking days in June). And this is during Pride month! Most of us are just chill like that I guess.
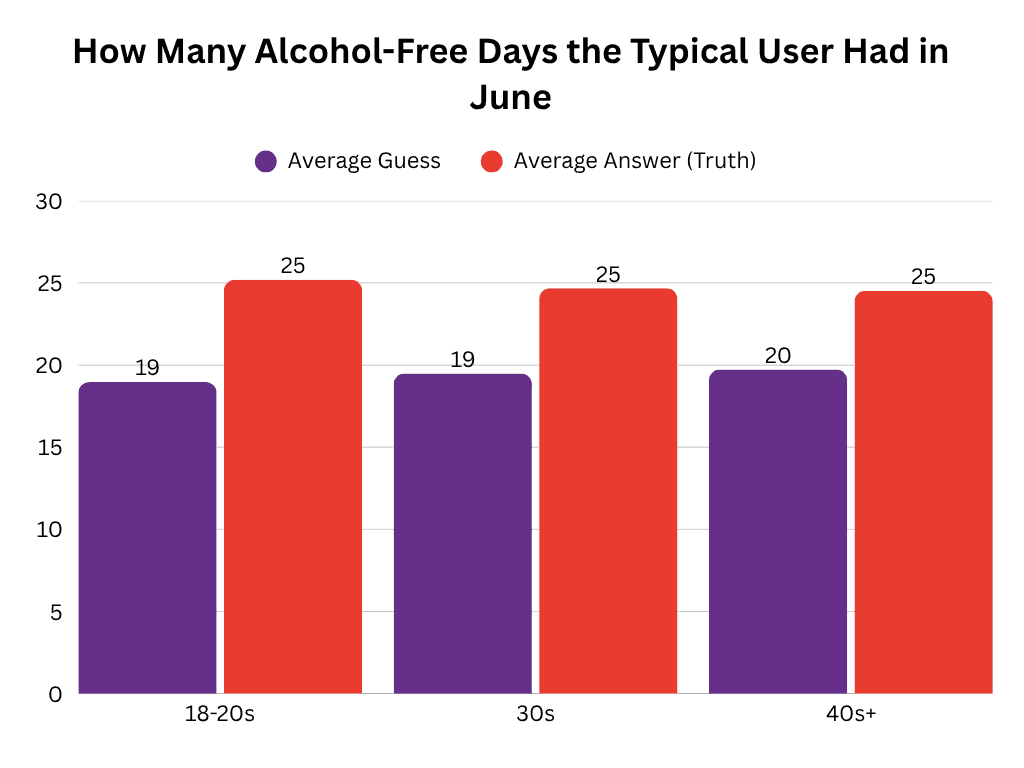
Younger users were actually the most sober of the group! This is a nationwide trend we’ve been seeing across the board too. Young people just aren’t drinking as much. I personally think it’s a combo of the drunk driving car crash installations seen during high school homecomings combined with the health craze aesthetic that is social media these days that has contributed a lot to this. I guess the interventions did their job!
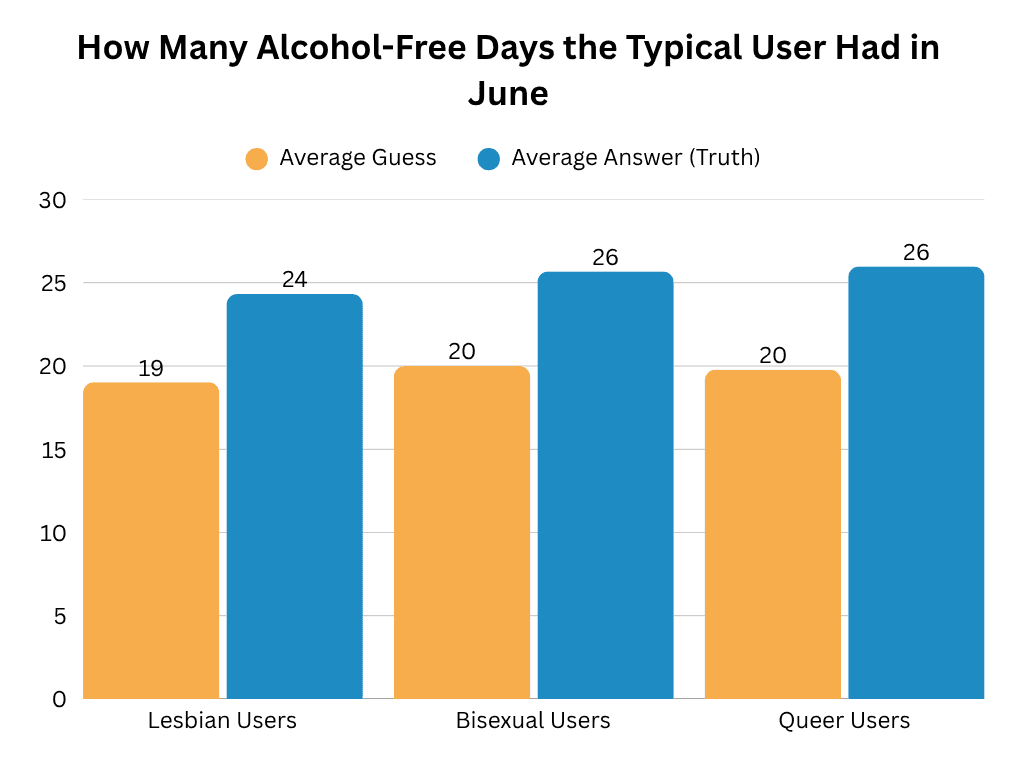
Identity groups were similarly close together, with lesbians reporting slightly fewer alcohol-free days than bisexual and queer users, though again, all three groups landed solidly on the sober side of the month. This lines up with what we found back in Set 3 Quarter 1, where over 70% of users reported drinking on 1 day or less per week, and it fits into the broader "sober curious" movement that's been picking up momentum within queer social spaces specifically (where drinking culture has historically been baked pretty deep into community-building). It's genuinely nice to see the data reflect that sapphics are finding other ways to connect that don't always run through a bar tab and leave you with a headache. Community 2.0 let’s goooo
That’s all I have for you today! I’ll see you in the app :)
XOXO SapphicSavvy
P.s. here's some additional readings if you're so inclined:
Sexual Partners:
Arts vs. Sports:
https://www.onstageblog.com/editorials/why-is-theatre-so-queer
https://medium.com/matthews-place/the-synergy-between-queerness-and-theatre-31e67ec2d351
Tops, Bottoms, and Versatiles:
https://diva-magazine.com/2023/04/25/lesbian-label-whats-in-a-name-anyway/
https://feeld.co/ask-feeld/how-to/a-guide-to-lesbian-identities
Sober Curious / Drinking Less: