Set 10 - Quarter 3
🎃 Gay Christmas, 🏡 Meet the Parents, 🎒 Go Bag Girlies, and 🍷 Coping Mechanisms
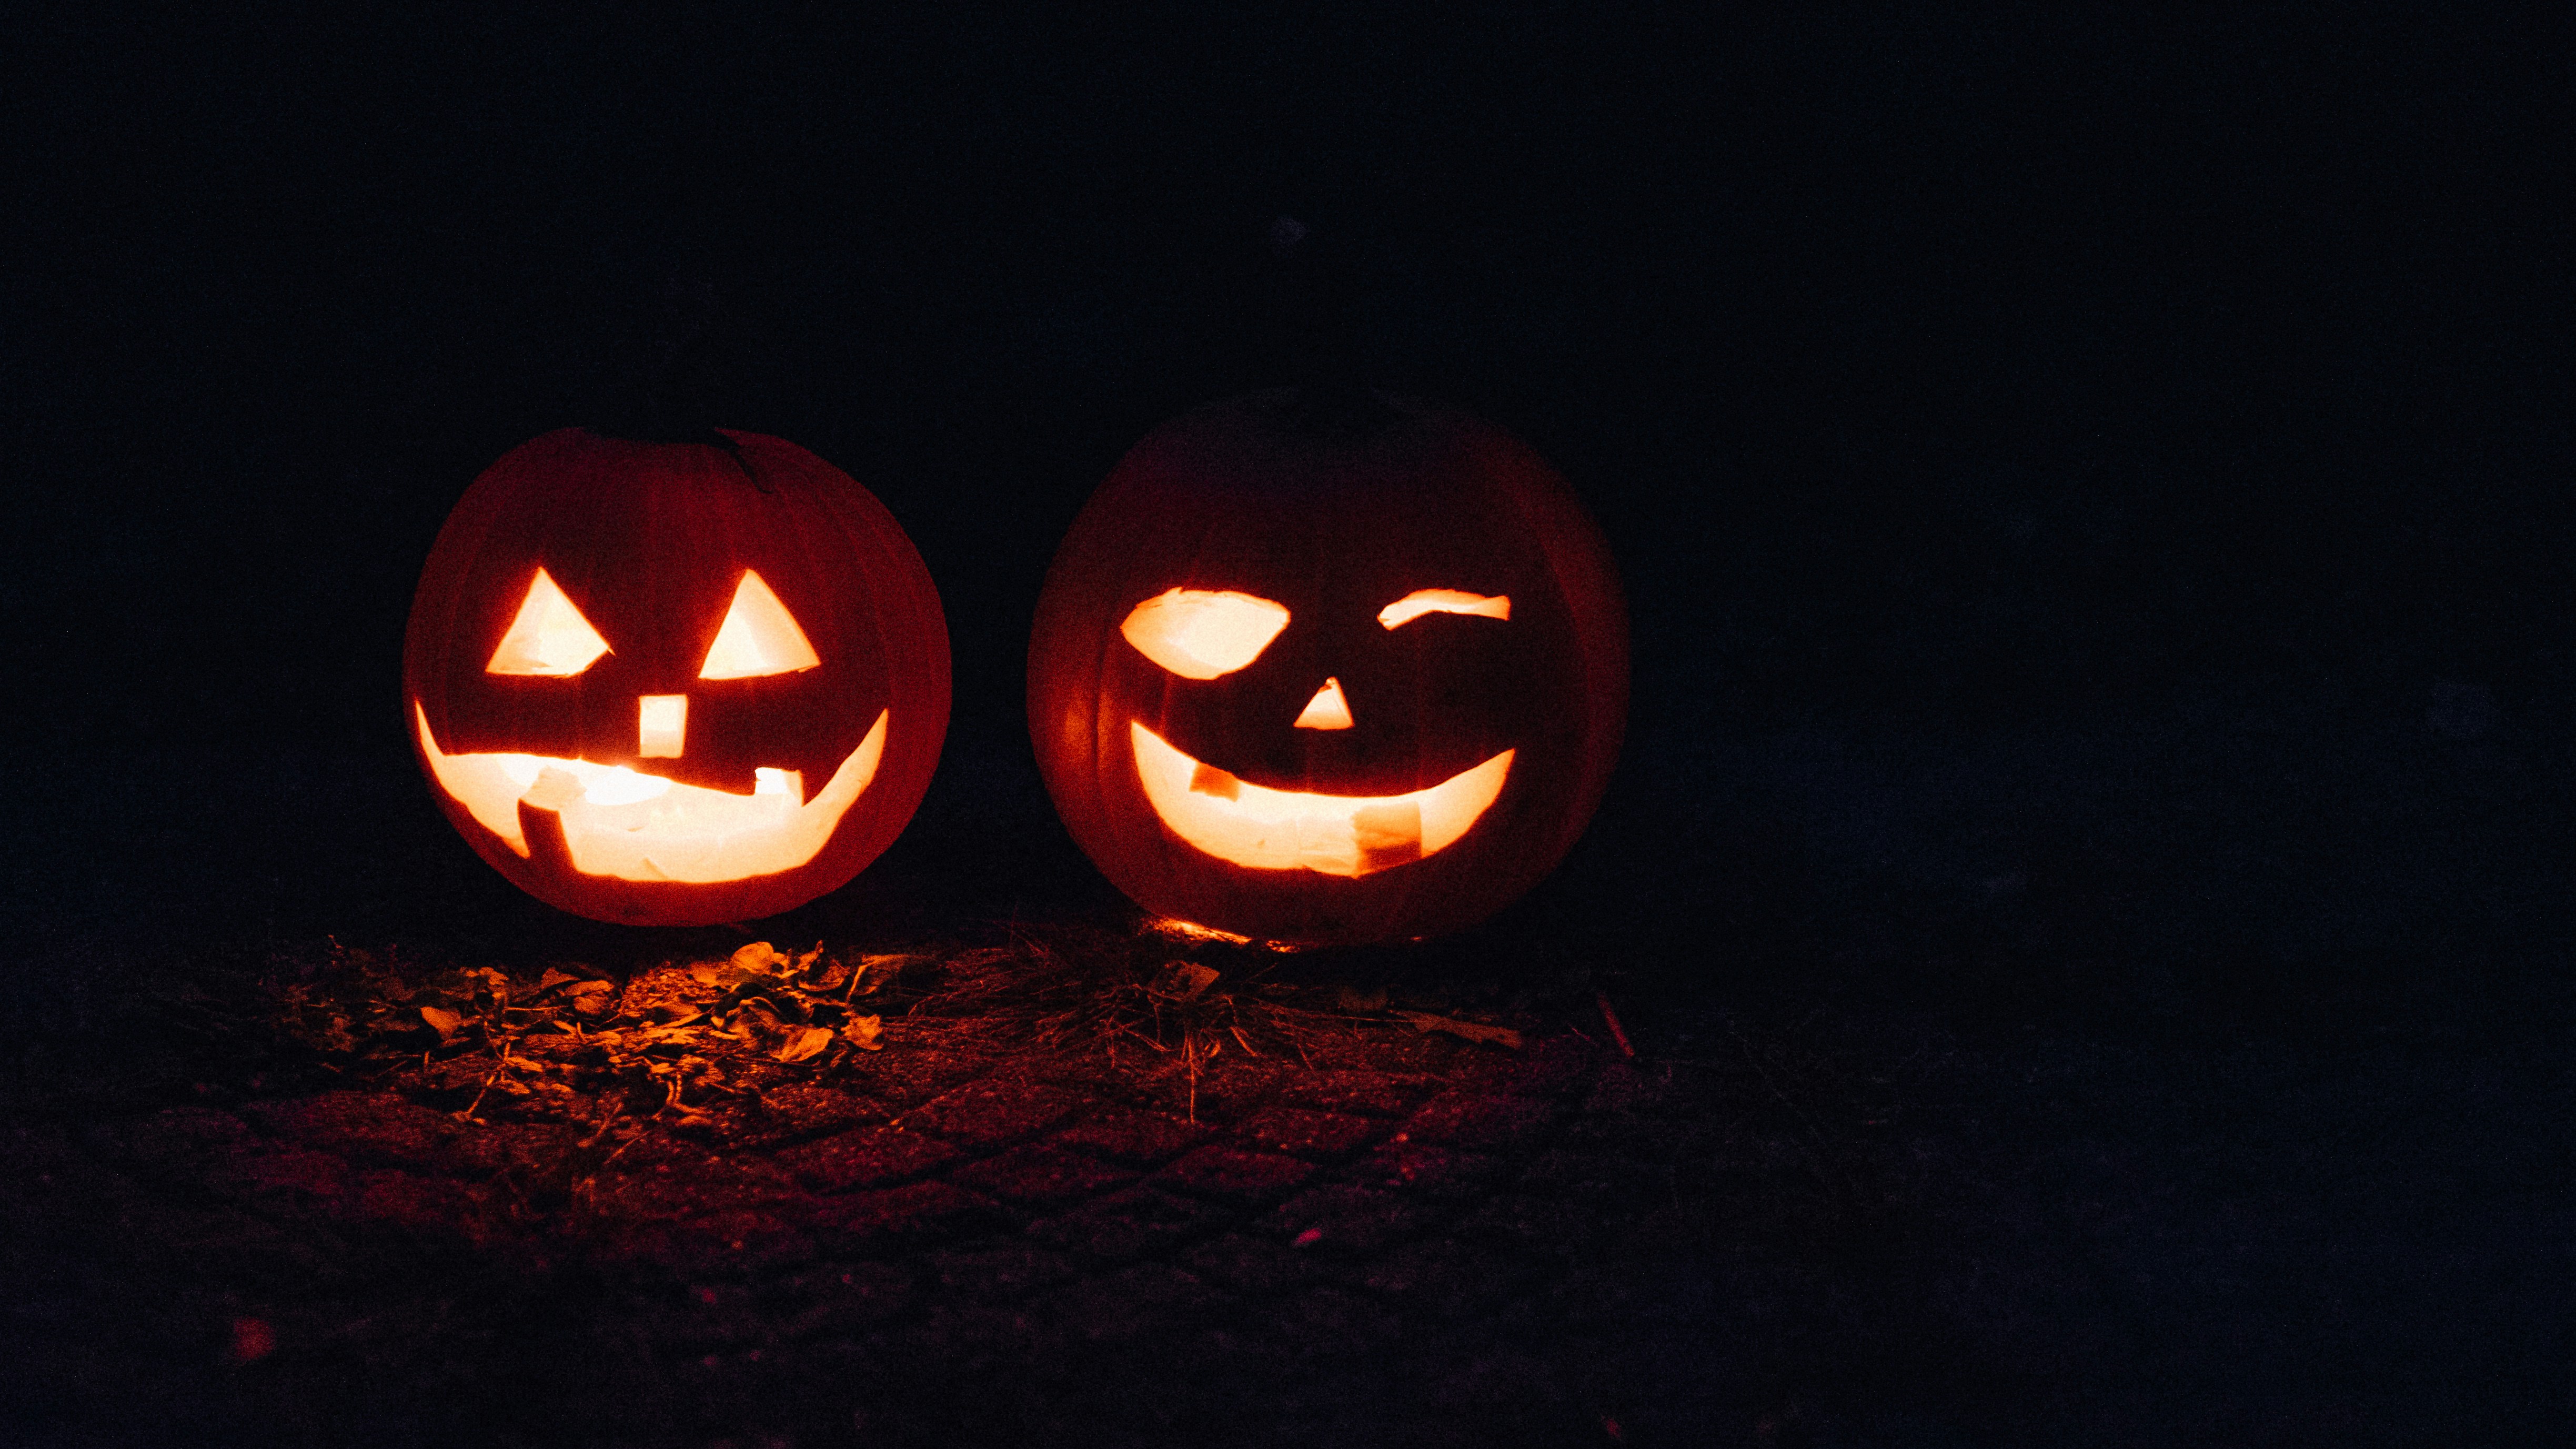
Hello from SapphicSavvy!
Set 10, Quarter 3. Halloween was nine days ago and somebody is still finding glitter in her car. This week: costumes, the parents, the go bag, and the drink after a bad day.
Let's go.
🎃 Gay Christmas
58% of users dressed up for Halloween.
Y'all guessed 64%.

Lesbian 55%, bisexual 55%, queer 67%.
Guesses vs. real, by identity:
Lesbians guessed 64%. Real: 55%.
Bisexual users guessed 61%. Real: 55%.
Queer users guessed 65%. Real: 67%.
Queer users, within about a point. Again. I'm not even surprised anymore.
Queer users topping the costume chart tracks. Back in Set 6 Quarter 2, over 90% of queer users said they were more into arts, crafts, or theatre than sports. A costume is just theatre you can wear to a bar.
For comparison, YouGov asked Americans in October 2024 and 27% planned to dress up. We're more than double that. It's called Gay Christmas for a reason. The nickname goes back to the 1950s and '60s, when queer people in cities like Philadelphia packed into gay bars on Halloween in drag. As historian Michael Bronski put it, it was the one night "you could wear drag and not get arrested." We've been showing up ever since.

Late teens 80%, 20s 59%, 30s 60%, 40s+ 49%.
Guesses vs. real, by age:
Late teens guessed 76%. Real: 80%.
20s guessed 68%. Real: 59%.
30s guessed 66%. Real: 60%.
40s+ guessed 56%. Real: 49%.
The late teens are the only group that dressed up more than they guessed. Four out of five. I'm picturing a dorm hallway full of sexy Bambis and matching Shrek onesies.
The 40s+ dropped below half, but hold on before anyone feels old. In that YouGov poll, 48% of Americans under 45 planned to dress up, and just 11% of everyone older did. Our 40s+ costumed at the rate of America's under-45s. Respect.
🏡 Meet the Parents
The typical user has introduced 2.1 partners to their family.
Y'all guessed 3.3.

Lesbian 2.4, bisexual 1.2, queer 1.9.
Guesses vs. real, by identity:
Lesbians guessed 3.3. Real: 2.4.
Bisexual users guessed 3.6. Real: 1.2.
Queer users guessed 2.9. Real: 1.9.
Everyone guessed high. Bi users guessed about three times their real number, and they had the highest guess of any group for the lowest real number.
Lesbians have introduced the most amount of partners, which surprises nobody who's read this blog. Remember Set 6
Quarter 2? Lesbians had the fewest lifetime sexual partners of the three groups. Fewest partners, most introduced to the family. Lesbians aren't dating. They're getting adopted. And in Set 8 Quarter 4, 34% of you had U-Hauled with someone you'd dated for three months or less. Hard to load a truck without her meeting your mom.
Bi users are the opposite. More partners than lesbians back in Set 6 Quarter 2, and fewer family introductions. I don't have a tidy theory. One possibility: an introduction only happens if someone's out at the dinner table. Pew's 2025 survey of LGBTQ adults found 35% of bisexual adults say none of their parents know, compared with 8% of gay and lesbian adults. That doesn't explain all of it, since Pew also found most partnered bi adults have a partner of a different gender. So that one stays an open question. Bi users, tell us in the chat.

Late teens 0.8, 20s 1.8, 30s 2.2, 40s+ 2.6.
Guesses vs. real, by age:
Late teens guessed 2.6. Real: 0.8.
20s guessed 2.9. Real: 1.8.
30s guessed 3.3. Real: 2.2.
40s+ guessed 3.8. Real: 2.6.
A nice, steady staircase. More years, more relationships, more awkward first dinners. Most late teens haven't done this even once yet. Enjoy it while it lasts.
For timing, a 2021 YouGov poll asked partnered Americans when they first met their partner's family. 25% said one to three months in, and 18% said four to six months. Holidays raise the stakes. In a Tawkify survey of 1,000 Americans, 72% said bringing a partner home for the holidays makes the relationship "feel official," and 39% said you should date at least six months first.
Thanksgiving is in 17 days. Plan accordingly.
And one callback for the folks who don't love this topic. In Set 6 Quarter 1, the typical user said just under five of her own family members fully support her identity and relationships. Not every family dinner is a warm one, on either side of the table.
🎒 Go Bag Girlies
37% of users have done doomsday or emergency prep.
Y'all guessed 33%. A little low!

Lesbian 34%, bisexual 36%, queer 45%.
Guesses vs. real, by identity:
Lesbians guessed 33%. Real: 34%.
Bisexual users guessed 38%. Real: 36%.
Queer users guessed 31%. Real: 45%.
Lesbians, less than a point off. Beautiful.
Queer users are the most prepared, and they undersold themselves by 14 points. This one should not surprise anybody. In Set 6 Quarter 4, queer users were our resident campers at over 1.5 camping trips a year. Back in Set 2 Quarter 1, 79% of all of you said you're handy enough for minor repairs. The water filter and the headlamp were already in the trunk of the Subaru.

Late teens 7%, 20s 34%, 30s 37%, 40s+ 48%.
Guesses vs. real, by age:
Late teens guessed 21%. Real: 7%.
20s guessed 31%. Real: 34%.
30s guessed 37%. Real: 37%.
40s+ guessed 35%. Real: 48%.
The 30s were off by half a point. The 40s+ are the most prepared group by a lot, and they guessed 13 points low.
The late teens: 80% of you dressed up for Halloween, and 7% of you have a go bag. You have a costume for the apocalypse, though, so that's something. (Zombie apocalypse only.)
For comparison, FEMA's 2023 National Household Survey found 48% of American adults had assembled or updated disaster supplies, and 51% felt prepared for a disaster. That's a slightly different question than ours, so it's not a perfect match. But we're in the same neighborhood as the country, with our 40s+ right on top of it.
What counts as "prep" has probably changed for a lot of us, too. The American Psychological Association's 2025 Stress in America survey found 76% of adults name the future of the nation as a source of stress, and 63% of 18 to 34 year olds have considered moving to another country. My guess is a few of you counted renewing your passport as prep. That counts. Whatever's in your bag, the queer users are probably happy to help you pack it.
🍷 Coping Mechanism
The typical user had 0.7 drinks to cope with stressors.
Y'all guessed 3.

Lesbian 0.9, bisexual 0.7, queer 0.5.
Guesses vs. real, by identity:
Lesbians guessed 3.1. Real: 0.9.
Bisexual users guessed 3.1. Real: 0.7.
Queer users guessed 2.8. Real: 0.5.
At least three times too high. Every group.
At this point it's a SapphicSavvy tradition. Set 3 Quarter 1: over 70% of you drink on one day a week or less, and we guessed higher. Set 4 Quarter 2: about 3 drinks on your heaviest night of the month, and we guessed higher. Set 5 Quarter 2: under one hangover a month, and we guessed higher. Set 6 Quarter 2: about 25 alcohol-free days in June, and we guessed 19. This week makes five. We keep picturing a much thirstier community than the one that shows up in the data.
Lesbians are a little higher than everyone else, which also isn't new. Lesbians had the most hangovers in Set 5 Quarter 2 and the fewest alcohol-free days in Set 6 Quarter 2. Still under one drink, though.

Late teens 0.4, 20s 0.7, 30s 0.8, 40s+ 0.9.
Guesses vs. real, by age:
Late teens guessed 2.5. Real: 0.4.
20s guessed 2.8. Real: 0.7.
30s guessed 3.0. Real: 0.8.
40s+ guessed 3.5. Real: 0.9.
The late teens guessed about six times their real number. Coping by drinking goes up a little with age, and that matches the country. Gallup's 2025 poll found the share of Americans who drink at all hit a record low of 54%. Among 18 to 34 year olds it was 50%, compared with 56% of people 35 and up. And 66% of young adults said even moderate drinking is bad for your health. The young people really aren't drinking. We said it in Set 6 Quarter 2 and it's still true.
The 40s+ drink the most to cope, but back in Set 4 Quarter 3 they were also the group most likely to meditate or do breathing exercises when stressed. They've got more than one tool in the kit.
Sincere beat now, on purpose. Of all the reasons people drink, drinking to cope is the one research ties most closely to problems later. In a study of nearly 1,000 lesbian drinkers, Robin Lewis and colleagues found that experiences of discrimination were linked to depression and feeling isolated, those were linked to drinking to cope, and drinking to cope predicted more drinks per week and more alcohol problems. That's minority stress in a glass. Most of you are well under one drink, and that's great. Some of you answered in the double digits. If that's you, no judgment. It's worth noticing, and our support section has resources if you want them. So does the group chat. And so does the queer user with the go bag.
🧵 The Thread
Here's how the guesses went this week:
Halloween: guessed 64%, real 58%. Too high.
Partners introduced to family: guessed 3.3, real 2.1. Too high.
Emergency prep: guessed 33%, real 37%. Too low.
Coping drinks: guessed 3, real 0.7. Way too high.
Three overs, one under. And it's the same rule as the last two weeks: we overcount what's loud and undercount what's quiet.
Costumes are the loudest thing on this list. Halloween is the one night a year everyone posts a full-body photo, so of course we guessed high. Meeting the family is a hard launch: the Thanksgiving table photo, the "my mom loves her" story at brunch. The partner who never met your family doesn't get a post. The coping drink is a meme. "I need a drink" is something everyone says after a bad day, and a lot fewer people actually pour one. And the go bag? It's literally designed to sit quietly in a closet. Nobody posts their go bag. So it's the one we undercounted.
Four for four again. Three weeks running.
The second pattern from last week held up too. Line up each age group's guesses, and on all four questions they roughly follow the shape of the real age numbers. The late teens guessed the most costumes and the fewest families. The 40s+ guessed the most families and the most coping drinks. Everyone pictured people like themselves. Psychologists call it the false consensus effect. I call it looking at your own group chat and assuming that's the census.
Running storylines:
The queer users can't stop nailing it. Halloween within about a point this week, on top of last week's retirement guess. And they're the campers from Set 6 Quarter 4 and now the preppers. If society collapses, find a queer user.
The bi overshoot is back. Last week bi users guessed low on themselves. This week they guessed 3.6 partners (real: 1.2) and 61% in costume (real: 55%). Babes. We were so close to the middle.
The lesbians had their own bullseye. Emergency prep within a point. And they've introduced the most partners to their family. Of course they have.
The 40s+ are still the most organized people here. Most likely to have prepped (48%) and the most partners introduced to family (2.6). Last week they were the top savers and early voters. Ask them where
the extra batteries are.
The 30s keep winning things. This week it's accuracy: emergency prep, guessed to within half a point.
The late teens, continued. 80% in costume, 7% with a go bag, 0.4 coping drinks. Last week it was 42% early voting and almost no retirement savings. Priorities, and honestly, good ones.
So here's the real typical sapphic of Set 10 Quarter 3. She probably dressed up for Halloween. She's introduced two partners to her family, and Thanksgiving might make it three. She doesn't have a go bag, but there's better than a one-in-three chance the girl next to her does. And when the week went sideways, she mostly didn't reach for a drink.
Costume on, go bag optional, drinks mostly imaginary.
One Quarter left in Heat 1. Go play.
XOXO SapphicSavvy
P.s. here's some additional reading if you're so inclined:
Gay Christmas:
https://yougov.com/en-us/articles/50782-what-do-americans-plan-to-dress-up-as-for-halloween-in-2024
https://www.nbcnews.com/nbc-out/out-life-and-style/halloween-gay-christmas-many-lgbtq-americans-rcna4027
https://www.autostraddle.com/halloween-costume-ideas-for-queer-couples-and-throuples/
Meet the Parents:
https://www.pewresearch.org/short-reads/2025/10/08/more-than-9-in-10-lgbtq-adults-in-the-us-are-out-to-someone/
https://www.pewresearch.org/short-reads/2024/06/28/for-pride-month-6-facts-about-bisexual-americans/
https://yougov.com/en-us/articles/37341-relationships-dating-marriage-sex-milestones-poll
https://www.datingnews.com/apps-and-sites/for-72-of-daters-bringing-a-partner-home-signals-commitment-and-risk/
Go Bag Girlies:
https://riskandresiliencehub.com/are-americans-prepared-for-disasters-femas-survey-reveals-key-findings/
https://www.apa.org/pubs/reports/stress-in-america/2025
https://mirkwork.com/buy-my-stuff/free-digital-zine-get-ready-a-gentle-guide-to-emergency-preparedness-and-building-a-go-bag
Coping Mechanism:
https://www.npr.org/2025/08/13/nx-s1-5501668/americans-drinking-alcohol-study-gallup
https://pmc.ncbi.nlm.nih.gov/articles/PMC5734637
https://www.newswise.com/articles/lesbian-and-bisexual-women-at-elevated-risk-of-problem-drinking-but-lack-appropriate-effective-treatment-options